the ultimate guide to baseball spray charts
Baseball spray charts provide documentation of at-bats and data that coaches and players can leverage. Traditional documentation involves pen and paper, marking each at-bat to paint a picture of a specific batter’s – or entire team’s – performance at the plate.
With the evolution of sports coaching technology, offensive charting and data analysis in baseball has expanded.
In this resource, we’ll cover everything you need to know about baseball spray charts. Continue reading to learn:
- What a spray chart is in baseball
- What they’re used for
- How to use them
- Modern technology and the evolution of spray charts

What Is A Baseball Spray Chart?
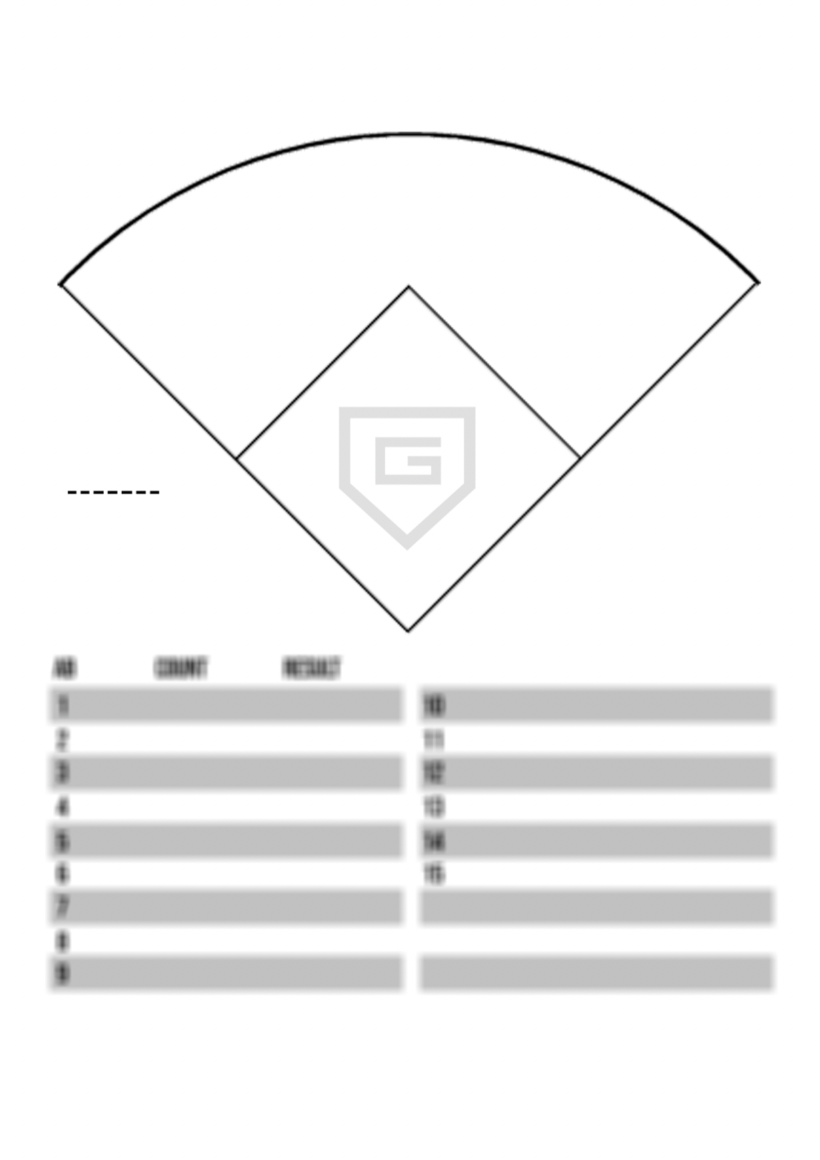
A baseball spray chart is a diagram of the baseball field that shows where each batted ball is put into play in a given period of time. It visualizes where hits land and outs are made, and helps paint a picture of each batter’s performance. Depending on the type of spray chart, it shows the location, hit type, and other information.
Some baseball spray charts are designed for one game, while others can track data throughout several games, a full season, or an entire career.
A basic spray chart in baseball plots a small solid circle or point to indicate the location of any given hit. Other variations may include:
- Different symbols for the type of hit
- Information about the batter, pitcher, other players, and game
- Strike zones to chart individual pitch locations in the at bats
- More detailed baseball scorekeeping information
- A blank section to take freehand notes
What Are Baseball Spray Charts Used For?
Baseball spray charts are used to document a batter’s performance through data. This baseball coaching tool provides data to identify strategic advantages in a game, prepare for an upcoming opponent, inform decisions that change the game’s outcome, and find areas of strength or weakness.
Specifically, coaches use baseball spray charts to:
- Record at bats
- Identify and highlight hitting tendencies
- Inform defensive strategy and positioning
- Tailor training sessions
Recording at bats
The most basic and fundamental purpose of a baseball spray chart is to track the location of each ball a batter puts into play. This allows coaches and teams to record and document performance at the plate in greater detail than a standard baseball scorekeeping card allows.
That information can be used for multiple purposes, some of which we’ll explain in the coming sections. At the very least, spray charts provide historical documentation of hitting performance in a given time period.

Identifying and highlighting hitting tendencies
Because the main function of a spray chart is tracking location, you can use them to identify and highlight hitting tendencies. If a right-handed batter has 90% of their chart marked in right field, it would be safe to say they tend to go the other way.
When you use a more advanced spray chart with special symbols and scorekeeping notes, you can form a rough overview of any player's tendencies at the plate.
Let’s take the previously mentioned right-handed batter as an example. With a spray chart that uses symbols for different types of hits and a strike zone visual for individual players, you can paint a better picture.
If you see all 90% of those hits to right field are shallow fly outs and notice there’s a mix of inside, middle, and outside pitches, you might conclude their hands aren’t fast enough to pull the ball. This would confirm your analysis of their tendency to go the other way.

Informing defensive strategy and positioning
By recording the location of every hit and identifying tendencies, baseball spray charts help inform a team’s defensive strategy and positioning.
- Ex. If your chart shows a left-handed batter on the opposing team consistently pulling the ball to the right side, you can use that information and shift your fielders over towards the first base foul line.
Coaches that keep historical spray charts or conduct detailed scouting can use previous data to inform their game strategy beforehand. By analyzing prior player performance, they have strategic advantages over coaches who don’t use spray charts or other pre-game scouting.
Spray charts can also inform in-game decisions that change the game’s outcome.
- Example: It’s the bottom of the final inning and you’re up by one run. A powerful right-handed batter steps up for the opposing team with two-outs and a runner on first.
- You check the batter’s spray chart and see that he’s burnt you on two gappers to right-center – a double and a triple that knocked in a combined four runs. It also shows their other two at bats were deep flyouts in between right and center field.
- Using the data, you move your center fielder closer to right and your right fielder closer to center – closing the gap. The batter hits a deep fly ball to the warning track in right center field, where one of your repositioned outfielders catches it to end the game. Your spray chart gave you the data to adjust your defensive strategy, avoid giving up another big hit, and secure the victory.
Tailoring training sessions
Coaches can use spray charts to highlight their own players’ tendencies and tailor training sessions accordingly. By visualizing the location of their hits and outs, coaches can identify issues in a player’s swing or approach and focus practice time toward fixing it.
For example, you have a left-handed batter that normally makes solid contact and hits for power to the gaps. Recently, they haven’t been getting on base and you take a look at their spray charts for the past several games. You see that they’re consistently grounding out to second and first base.
Between your view of their performance and the spray chart, you decipher that they’re swinging out of control and rolling over the ball. In the coming days of practice before your next game, you lock in on baseball hitting drills like tee work and soft toss to get back to basics and return to proper form.
Outside of training sessions, coaches can use spray charts to make in game adjustments. That same example can be condensed to a single game. The batter was hitting for power in your last game, but grounded out to the right side three times in this game so far.
You approach the player and discuss adjustments based on your insights. They may even have a chance to work on their approach and form in between innings in the cage. At their next at bat, they return to form and drive a double to the left-center gap with a smooth, controlled swing.

How To Use A Baseball Spray Chart
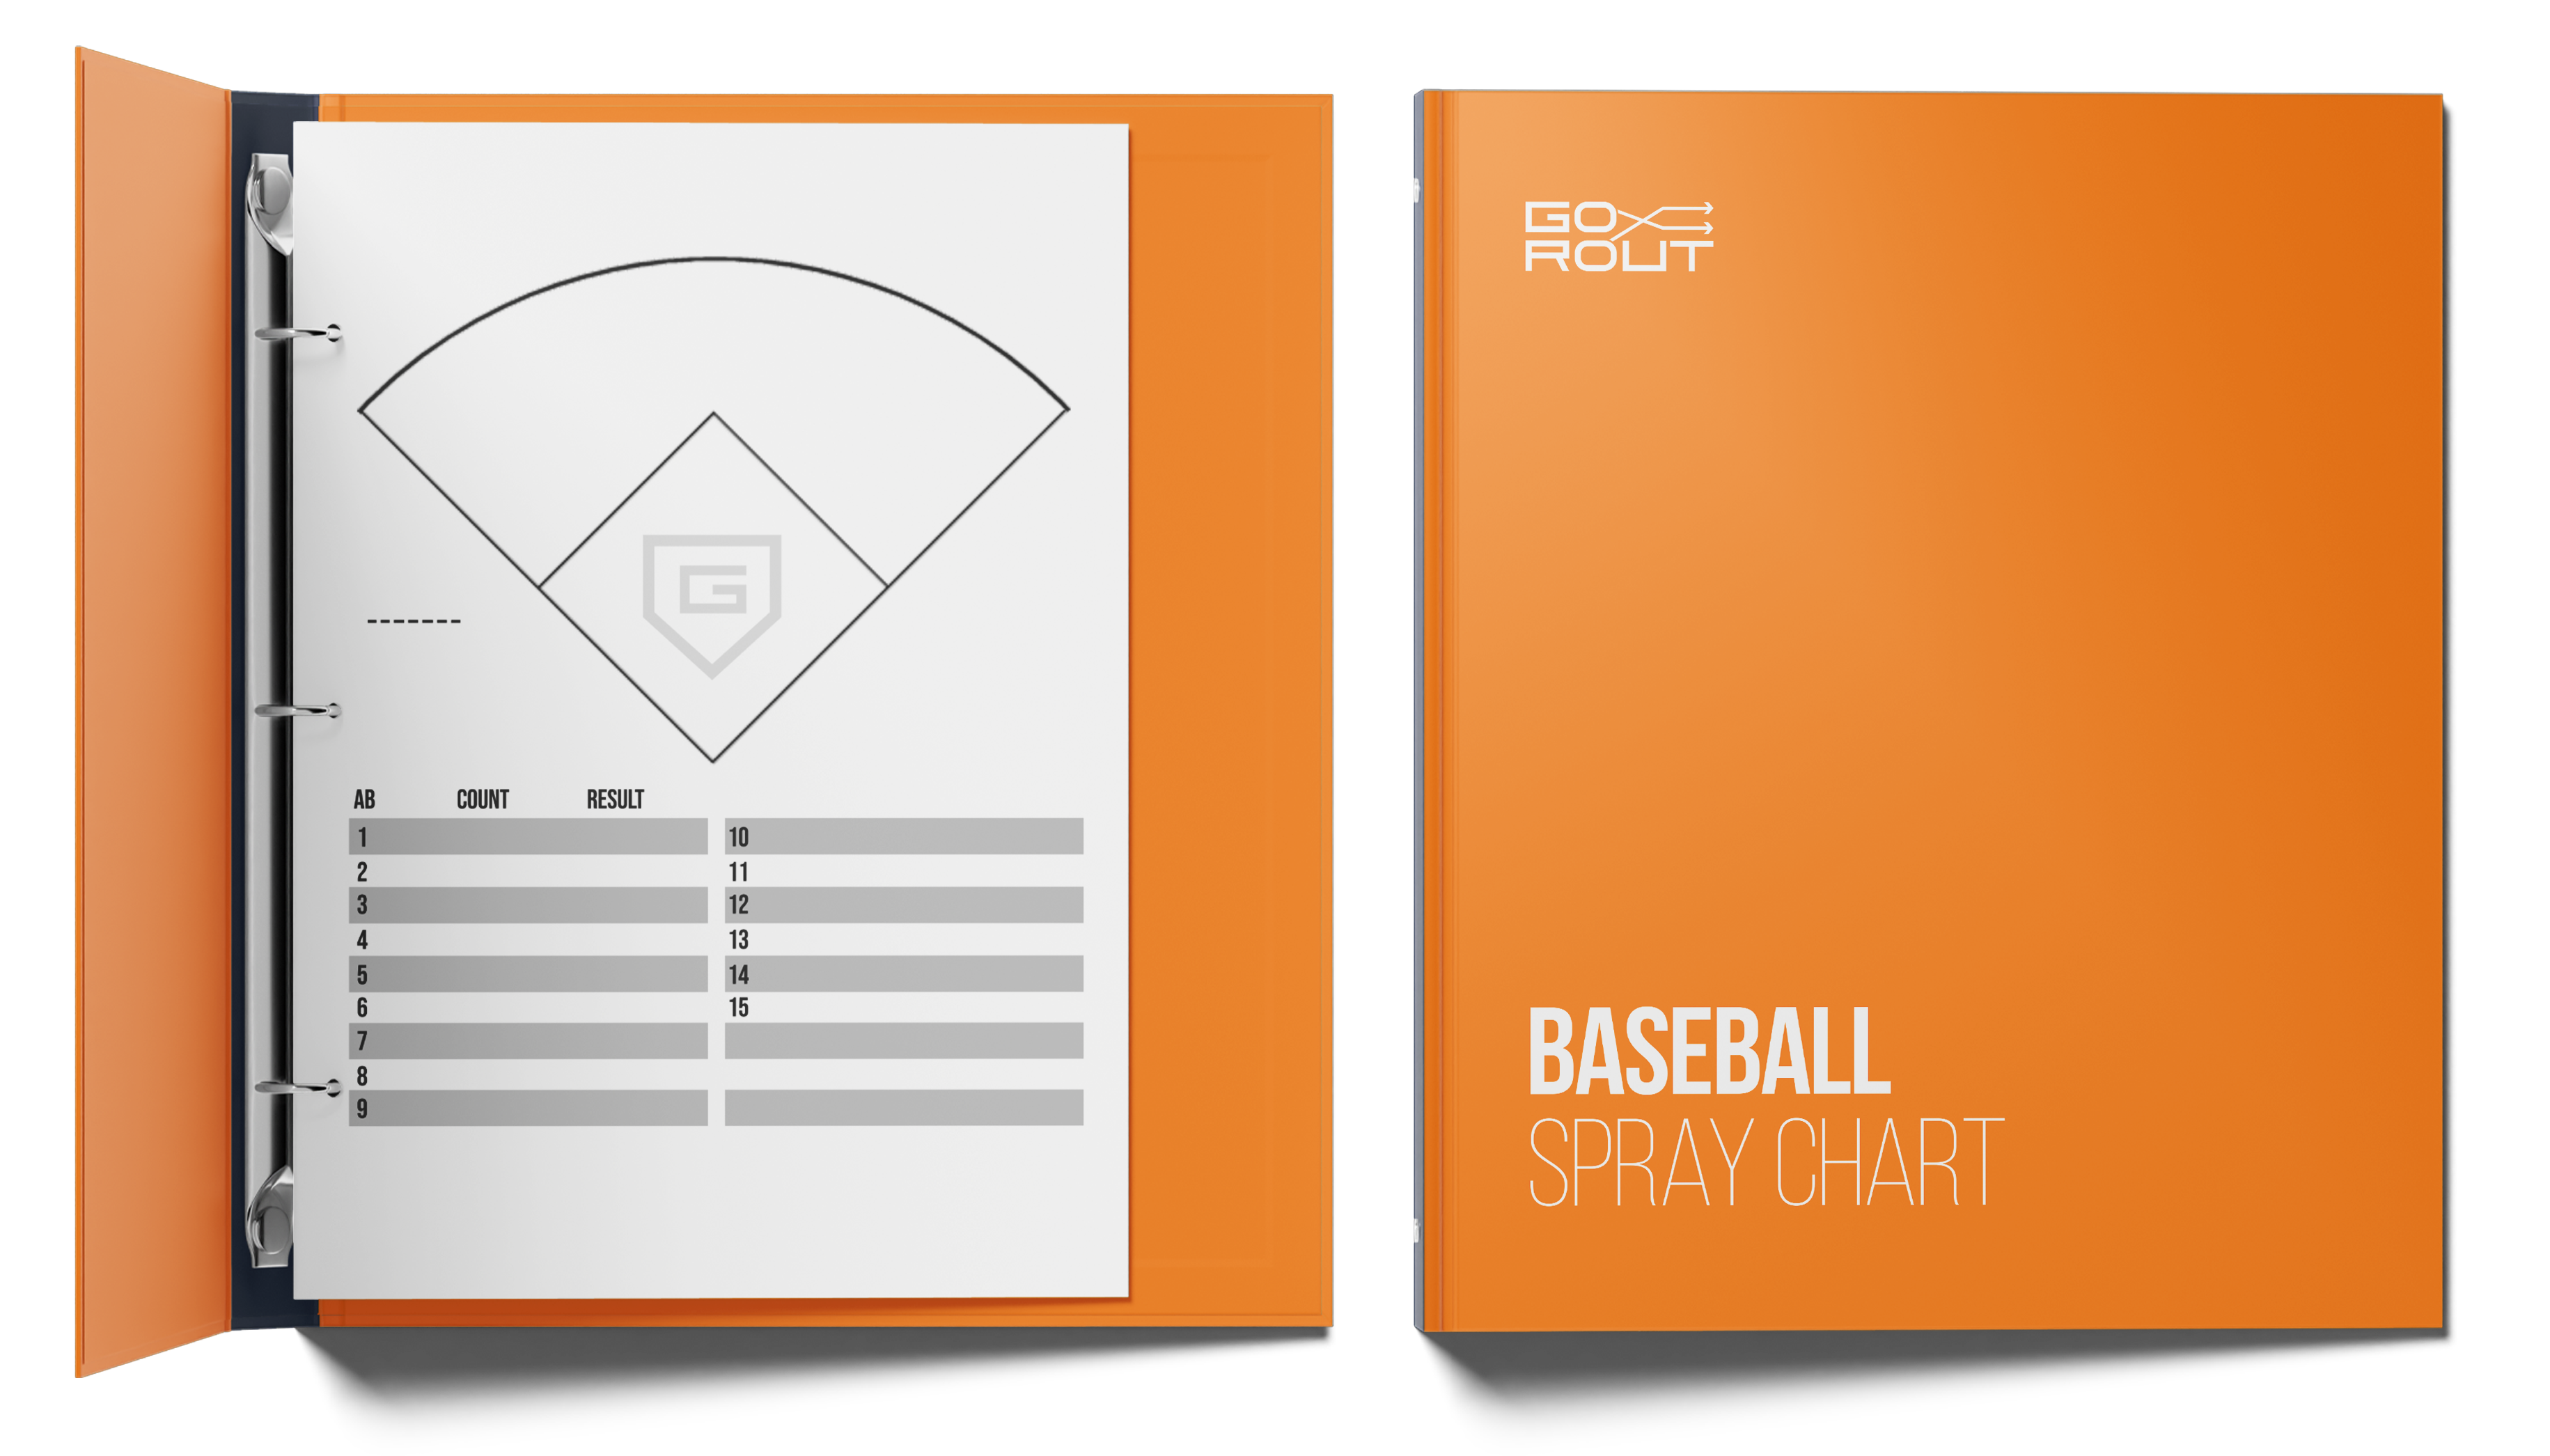
To use a basic baseball spray chart, simply mark a dot or other symbol in the location of each batted ball on the field diagram. This provides minimal insight into each play, but paints a broad picture of where the batter hit the ball.
More advanced baseball spray charts allow you to document information in greater detail, including:
- Specific symbols for different types of plays
- General notes about the game and players
- Technical baseball scorekeeping
- Strike zones to track pitch location
- Open notes for any additional insight
Symbols for different types of plays
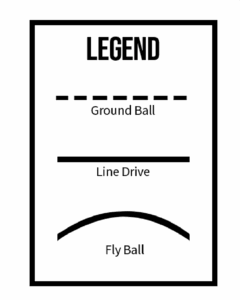
While a basic spray chart uses dots to mark location, advanced charts incorporate a system of symbols to provide more data around each play. Specifically, symbols indicate the type of contact the batter made – fly ball, ground ball, or line drive.
The most common symbols used are:
- Fly ball: Arched line
- Ground ball: Dotted line
- Line drive: Straight line
Most spray charts include a legend or key that defines and exemplifies what symbol indicates each type of hit. The legend or key is typically a box or rectangle located somewhere on the edge of the chart – in one of the corners, or as a header or footer.
Use the key to accurately mark each batted ball and provide a granular look into each batter’s performance.
General notes about the game and players
Every baseball spray chart has a different design. Some options provide nine or more mini-diagrams to track an entire team’s performance on one page. Others have larger diagrams and more information, with one sheet for each player.
At the very least, most spray charts provide sections to fill out the following information:
- Batter’s name, number, dominant hand, and team
- Name and dominant hand of all pitchers faced
- Date and location of game
Some spray charts provide areas to track tendencies and insights such as each player’s likelihood to:
- Steal
- Bunt
- Swing at the first pitch
- Be put away by a certain pitch
In addition to pre-labeled sections, certain designs provide an area to write freehand notes. This allows you to document thoughts, observations, or insight outside of the predetermined categories. That can range anywhere from observations about a specific at bat to detailed tendencies and strategic approach to combating or exposing them.

Technical Baseball Scorekeeping
To put context in your documentation, some charts include sections or instructions for traditional baseball scorekeeping practices.
That can include:
- A box or section to write the final outcome of each at bat (ex. F7 for a flyout to left field)
- A section to mark balls and strikes of each at bat
- Marking runners on base at the time of an at bat
- Tracking the number of outs at the time of an at bat
This adds additional context and clarification about the game at the time of each at bat.
Strike Zones & Pitch Locations
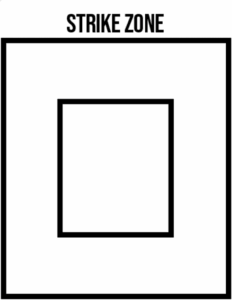
Spray charts that provide the most detailed account of each at bat include visuals of the strike zone to track pitch location. A small rectangular box represents the strike zone, much like you’d see on a pitching chart.
With each pitch, you mark:
- The number of each pitch in sequential order
- The location of each pitch
- The type of pitch (optional)
- Whether the batter swung or not (optional)
Tracking pitch location provides a more granular look into a batter's tendencies, strengths, and weaknesses. If you notice that a batter consistently swings and misses at fastballs up and in, you can adjust your strategy in game to attack that weakness. A basic spray chart doesn’t provide that level of depth in documentation.
Open Notes For Additional Insight
In addition to pre-labeled sections, certain designs provide an area to write freehand notes. This allows you to document thoughts, observations, or insight outside of the predetermined categories. That can range anywhere from observations about a specific at bat to detailed tendencies and strategic approach to combating or exposing them.

Modern Technology and Baseball Spray Charts
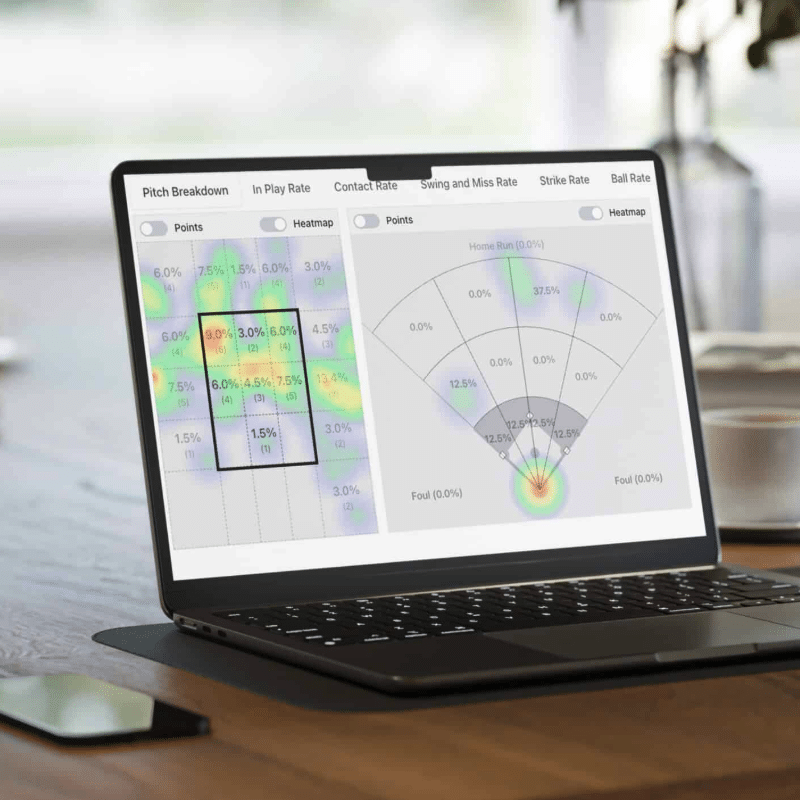
The evolution of technology in sports has created modern versions of baseball spray charts. These range from using a tablet to electronically document batters to incorporating video analysis and AI data generation.
Electronic baseball spray charts enable you to document and analyze offensive performances in the same manner as traditional pen and paper – just on a phone, tablet, or laptop computer. The biggest benefit comes after the fact, when you can filter and sort through data to create customized views and tailor the data you’re looking at to best suit your needs.
Video analysis and AI data generation takes spray charts to a new level. These tools allow you to leverage video for scouting. With video documentation of each at bat, you no longer need to rely solely on written data to provide insights and develop strategy. Depending on your video analysis technology, you can create spray charts manually or leverage artificial intelligence (AI) to compile the data.
Conclusion
As a coach, spray charts benefit your team and success in multiple ways. You get detailed documentation of your team and opponent at-bats, identify tendencies, and inform practice and game strategy.
Teaching your players to use spray charts provides additional knowledge and understanding of the game. Over time, they begin to develop an eye for identifying tendencies and formulate their own strategies on how to attack or leverage the data.
Whether you use traditional pen and paper or advanced technology, spray charts are an important component of statistical analysis to incorporate in your program.
Baseball Spray Chart FAQs
What is a spray chart for baseball?
A spray chart for baseball is a diagram of the field that displays where batted balls and hits are put into play within a given period of time. They can incorporate additional information like pitch locations and notes.
Spray charts are used to scout other teams to develop game strategies. They’re also used to identify your team’s tendencies and habits, tailoring your practice and training program.
Traditional baseball spray charts are paper while modern options incorporate technology and artificial intelligence (AI).
Are spray charts used exclusively for baseball?
No, softball teams also use spray charts. Each chart is designed for the specific sport, so there are nuances between the two types.
Track your team's performance & improve your strategy with gorout's free baseball spray chart
Track Contact Quality and Trends
Quickly log every at-bat to identify hitting patterns and tendencies. The spray chart makes it easy to spot strengths and weaknesses, helping you create individualized development plans for each hitter.
Make Smarter Defensive Adjustments
Use spray data to position your defense more effectively. By visualizing where players consistently hit the ball, coaches can set lineups and shifts with confidence.
Simple and Coach-Friendly Design
The clear, printable layout keeps tracking effortless during games or practices. It’s an ideal tool for both competitive coaches and player development staff.
