Baseball Analytics Tools: Why GoRout Connect Leads the Game
Reading Time: 9 minutes
Reading Time: 9 minutes
Baseball has always been a numbers game, and baseball analytics tools take data analysis to a new level. Modern technology turns those numbers into real-time insights that can change how you coach, train, and succeed.
GoRout Connect leads the game because it brings advanced baseball analytics tools directly into your dugout, giving you instant, automated data that improves decision-making on every pitch.
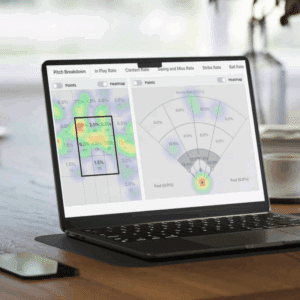
You can now track pitch intent versus result and view heat maps. GoRout’s connected system also syncs baseball spray charts automatically, so you analyze everything in one place.
These tools help you understand player performance and spot trends. You can fine-tune strategies without slowing down your game day process.
In this guide, we will talk about the basics of baseball analytical tools and explain why GoRout Connect should be your first choice for boosting your team’s performance and getting more wins.
The Basics of Baseball Analytics Tools
Baseball analytics tools help you understand player performance and team strategy using real data over gut feelings alone.
You can track everything from pitch velocity to swing efficiency, giving you insights that guide smarter coaching and roster decisions.
Analytics has come a long way from simple box scores and basic baseball scorekeeping. In the past, you might have relied on batting average or earned run average.
Today, tools like Statcast and PITCHf/x measure spin rate, launch angle, and defensive range in real time. That makes analysis both faster and more precise.
Teams at every level, Major League, college, and even youth, now invest in analytics because it improves consistency and reduces risk.
With these tools, you see trends that old-school stats can’t show, helping you plan lineups, prevent injuries, and develop players more effectively.
| Then | Now |
| Batting average and ERA | Launch angle, exit velocity, spin rate |
| Manual scorekeeping | Automated tracking systems |
| Gut-based scouting | Data-driven player evaluation |
| Static reports | Real-time dashboards and AI insights |
With the right analytics tools, you get a clear view of what really drives performance. You make decisions based on facts, instead of hunches, and give your players every chance to succeed.
Analyzing Player Performance With Baseball Analytics Tools
You can monitor hitters by tracking exit velocity, launch angle, and on-base percentage (OBP). These numbers show how often a batter makes solid contact and how productive each at-bat is.
For pitchers, analytics highlight spin rate, release point, and pitch location. It helps you evaluate control and movement, which are key to consistent pitching.
Defense matters too. Tools measure route efficiency and reaction time, so you see how well players move to the ball and complete plays.
Using real-time feedback for in-game decisions
With live data from systems like GoRout Connect, you can adjust strategy instantly. Coaches see pitch trends, hitter zones, and pitch trends and hitter zones in real time.
This feedback helps you decide when to switch pitchers, shift defense, or change a hitter’s approach. Every play gets guided by clear, actionable numbers.
How GoRout Connect Improves The Coaching Experience
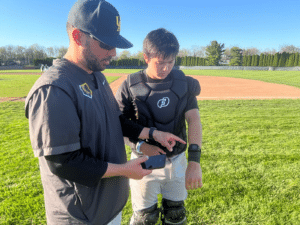
GoRout Connect helps you manage your team with confidence by linking communication, analytics, and practice tools in one simple system. You can share information instantly with players and staff, keeping everyone on the same page during games and training.
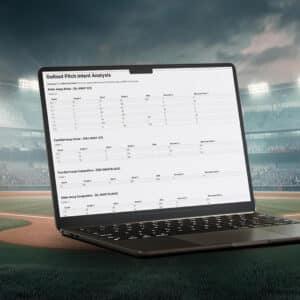
The system gives you real-time data that’s easy to read and actually use. You can view strike zone maps, spray charts, and pitch intent vs. result summaries that show exactly how your pitchers perform.
It helps you plan bullpen work and make better in-game decisions.
| Feature | What It Does | Coaching Benefit |
| Live Syncing | Links your pitch library and game data automatically | Saves time and reduces manual tracking |
| Visual Analytics | Displays heat maps and charts by pitch type | Highlights player strengths and areas for improvement |
| Secure Communication | Uses encrypted coach-to-player messaging | Builds trust and keeps signals private |
| Integrated Access | Connects GoRout Diamond with AWRE Sports tools | Simplifies your workflow and analysis |
You can use GoRout Connect to manage practices more efficiently. Instead of juggling multiple apps, you track and adjust drills directly from your tablet.
It gives you more time to coach and less time entering data.
Coaches and managers who use GoRout Connect describe it as trusted, simple, and built by people who actually get team needs. Get a quote to see how it fits your program and helps your team play smarter.
The Role Of Video Tools In Baseball Team Improvement
Video tools help you see what raw numbers can’t. They let you view mechanics, timing, and body movement in real time, giving you a clear picture of how players perform under game pressure.
When you pair video analysis with data, you make faster, evidence-based improvements. You can track every pitch, swing, and play using live and recorded videos.
It makes it easy to spot small flaws that affect results, like a late swing or inconsistent release point.
Coaches can pause, rewind, and compare clips side by side for a deeper breakdown. Video complements analytics by showing the “why” behind the numbers.
Baseball data analysis might show a drop in exit velocity, while video reveals a shorter follow-through. Together, they help you fix problems more effectively and avoid guesswork.
Teams use video tools to fine-tune both pitching and hitting mechanics. For pitchers, slow-motion replays highlight arm angles and stride length.
For hitters, they expose timing issues and contact points. These insights support safer, more efficient movement patterns.
| Use Case | Video Insight | Team Benefit |
| Pitching form | Arm slot and release timing | Prevents fatigue and improves control |
| Hitting motion | Swing path and contact zone | Boosts consistency at the plate |
| Fielding plays | Reaction and positioning | Enhances defensive awareness |
Connecting video tools with systems like GoRout Connect lets you review live footage instantly. Each view turns into actionable coaching feedback.
Evaluating And Developing Players With Baseball Analytics Tools

You can evaluate and develop players faster when you use baseball performance analysis that tracks results deeper than surface level stats. It reveals how each athlete contributes to wins and helps you identify talent with more confidence.
Identifying strengths and weaknesses with analytics
Modern analytics platforms measure exit velocity, launch angle, pitch spin rate, and defensive range. You see what a player does best and where there’s room to improve.
| Metric | What It Measures | Why It Matters |
| WAR | Total player value | Compares overall impact |
| wOBA | Offensive efficiency | Evaluates hitting quality |
| FIP | Pitcher control | Focuses on outcomes they influence |
| Route Efficiency | Fielding accuracy | Tracks defensive performance |
By comparing these numbers across seasons, you can spot consistency, growth, and hidden potential that traditional scouting might miss.
Supporting player development in practices and scrimmages
Tools for analytics in baseball like GoRout Connect let you turn data into action. You can review pitch results, swing paths, or defensive positioning right after each play.
During training, this feedback helps tailor drills to individual needs. When players see their metrics improve, they stay motivated and understand how small adjustments drive progress.
Advanced Metrics And Statistics In Baseball Analytics Tools
You can now turn complex baseball data into actionable insights that improve every play. Modern baseball scoring software like GoRout Connect help you understand what’s really happening on the field by collecting and analyzing advanced metrics in real time.
Key modern metrics
Advanced stats go way beyond batting average or ERA. You now track details that reveal a player’s full performance picture.
| Metric | What It Measures | Why It Matters |
| Exit Velocity | Speed of the ball off the bat | Predicts hitting power and consistency |
| Launch Angle | Vertical angle of batted balls | Shows swing efficiency and contact quality |
| Spin Rate | Revolutions per minute on a pitch | Affects pitch movement and deception |
| FIP (Fielding Independent Pitching) | Pitcher results excluding fielding | Evaluates pitching skill more fairly |
| WAR (Wins Above Replacement) | Total player value | Compares players across positions |
These numbers give you clear, measurable information that sabermetricians once spent hours calculating manually. Now, GoRout Connect delivers them instantly through automated reports.
Get a quote today.
How coaches interpret data to build strategies
You can use this analysis to adjust lineups, pitch calls, and defensive shifts. When your tool turns raw data into easy-to-read reports, you see patterns you might have missed.
Coaches use these insights to balance instinct with evidence. Instead of guessing, you make informed choices that improve player performance and team efficiency every game.
Movement And Health Monitoring With Baseball Analytics Tools
AI in baseball helps you track how athletes move and recover. By combining motion data with health metrics, you can spot fatigue early, reduce injury risk, and improve training efficiency.
Wearables and biomechanical tracking
You can use wearable devices, like smart sleeves or compression shirts, to track heart rate, workload, and joint stress. These baseball analytics tools gather movement data during practices and games, so you get a real sense of how each athlete’s body responds under pressure.
Biomechanical tracking software measures arm angle, stride length, and rotation speed. That helps you spot inefficient or risky motion patterns pretty quickly.
Pair these readings with reports from GoRout Connect and you’ll see all your performance data line up. It can save time and improve results.
| Metric Type | Example Data | Benefit |
| Motion | Arm angle, stride length | Detects mechanical flaws |
| Workload | Pitch count, sprint speed | Prevents overuse |
| Recovery | Heart rate, sleep quality | Improves readiness |
Preventing injuries with workload and motion analysis
Analytics tools let you track workload trends and spot when players need rest. If your pitcher’s velocity drops or recovery slows, you can tweak training before fatigue turns into something worse.
When you monitor motion quality and recovery together, you can manage loads with more confidence. It’s a practical way to keep athletes healthy and ready to go.
Baseball Analytics Tools In Educational Institutions

Now you’ll see high schools and colleges using baseball analytics tools to show players how data shapes performance. Coaches track things like exit velocity, launch angle, and spin rate to guide training.
College baseball analytics help student athletes learn how to make modern decisions based on math, computer science, and technology, paired with real on-field results.
Preparing student-athletes for higher levels of competition
Using analytics in training helps student-athletes get ready for college or pro play. Data points out where they shine and where there’s room to grow, so they can make practice time count.
GoRout Connect gives schools a simple way to collect and review performance data without breaking the bank. Students learn how to interpret analytics just like the pros do, which is a solid skill for the next level.
When athletes learn this early, they get comfortable using data to back up their instincts. That’s huge for thriving in programs that rely on analytics-driven coaching.
Application Of Analytics Tools In Other Sports
Analytics tools aren’t just for baseball anymore. You see them shaping football, softball, basketball, and every major sport. You can apply AI-driven insights to predict outcomes and help guide in-game decisions.
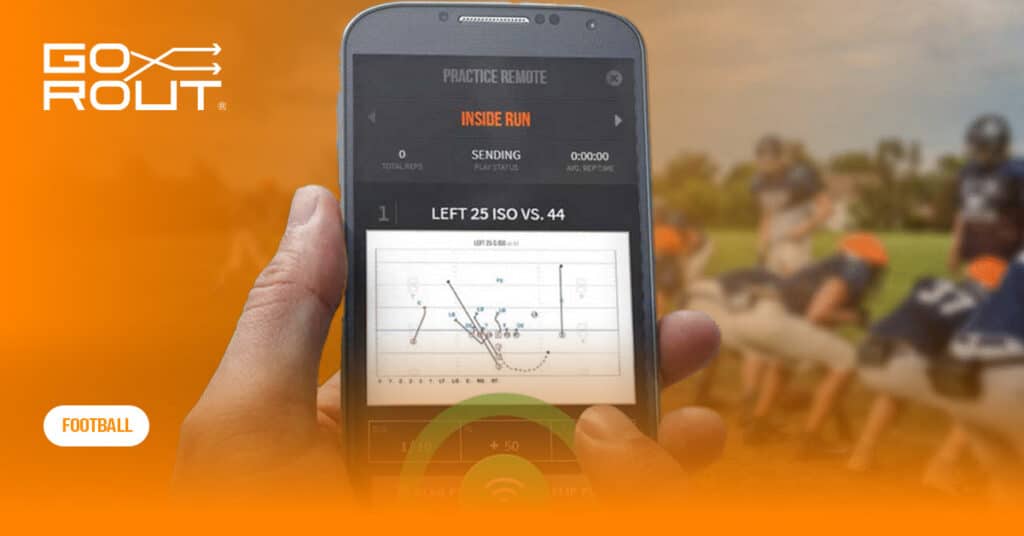
Football, for example, uses data tracking to refine plays and manage workloads. Also, football coaches lean on real-time communication and video analysis to adjust formations and call plays on the fly.
Softball analytics digs into pitch sequencing, swing paths, and player reaction times. It’s pretty similar to how baseball managers use pitch data or defensive shifts.
Conclusion About Baseball Analytics Tools
You have more ways than ever to use data to make smart baseball decisions. Analytics tools show you what’s happening in every game and season, and you can act fast when it matters most. The right system saves you time and keeps your focus on making better calls.
GoRout Connect stands out because it combines real-time data, simple setup and clear reports. You can track pitch results, spray charts and strike zones without extra steps. Each feature helps you answer the big questions: who’s performing well, when to adjust and where to improve.
| Feature | What It Does | Why It Matters |
| Instant Syncing | Updates data automatically | Saves time during games |
| Pitch Intent vs Result | Compares plan to outcome | Improves decision-making |
| Spray Charts | Maps contact zones | Guides defensive shifts |
| Strike Zone Maps | Shows hot and cold spots | Refines pitcher strategy |
Using GoRout Connect helps you turn data into action instead of spending hours sorting numbers. It’s built for coaches who want fast, clear insights without losing focus on the game.
If you’re ready to make analytics part of your everyday coaching, get a quote and see how it can help your team make smarter decisions this season.
FAQs About Baseball Analytics Tools
How are analytics used in baseball?
You use analytics to make coaching and player decisions that actually make sense. Teams track hitting, pitching, and fielding data to find patterns that boost performance.
Analytics tools measure exit velocity, spin rate, and launch angle. They help you adjust training plans and in-game tactics using real numbers instead of gut feelings.
What are five tools in baseball?
Here are five common analytics tools teams use today:
| Tool | Purpose |
| Statcast | Tracks player movement, pitch speed, and ball trajectory. |
| PITCHf/x | Measures pitch type, velocity, and location. |
| TrackMan | Uses radar to analyze pitching and hitting mechanics. |
| Rapsodo | Captures real-time pitching and hitting metrics for training. |
| GoRout Connect | Syncs live game data with coaching decisions for instant feedback. |
These tools help you see performance from every angle.
What is the best site for baseball stats?
You’ll find detailed stats on Baseball Savant, which is the official MLB platform. It’s got advanced data like xERA, launch angle, and spray charts.
Or check out FanGraphs and Baseball Reference for player comparisons and historical stats. Both are worth a look.
What is the best app to analyze baseball swings?
When it comes to swing tracking, Blast Motion and Rapsodo Hitting 2.0 are good options. These apps track bat speed, attack angle, and the quality of contact.
Looking for something that fits into your team’s routine? GoRout Connect links data collection with instant reports, so swing analysis slips right into your regular coaching flow.
Share This Article
Related Articles


Big-League Analytics in your dugout for free
With GoRout Connect, GoRout Diamond customers receive access to AWRE Sports suite of analytics tools for free!