How Baseball Performance Analysis Improves Team Results
Reading Time: 7 minutes


Reading Time: 7 minutes
The difference between a good baseball team and a great one often comes down to how well it uses information. Baseball performance analysis has transformed the game by turning numbers into meaningful insights that shape lineups, pitching choices, strategic decisions, and player development.
These days, instead of just going with their gut, managers and analysts can actually make decisions backed by solid data. This change has transformed the way the game is played, making every move on the field smarter, sharper, and more strategic.
In today’s guide, you will learn the basics of baseball performance analysis and how it helps you improve your team’s performance.
The Basics of Baseball Performance Analysis

Baseball’s always been a numbers-driven sport. Batting averages and earned run averages tell the story of every play. You can use these stats to measure success and compare players. They help you spot trends that shape your team’s strategy.
Early baseball relied on simple box scores and scorekeeping printed in newspapers. Those tracked hits, runs, and errors. As technology and computing power grew, those simple stats evolved. Now, complex models show how every pitch, swing, and catch affects the game.
You’ve got advanced metrics like WAR (Wins Above Replacement), wOBA (Weighted On-Base Average), and FIP (Fielding Independent Pitching).
| Era | Key Metrics | Focus |
| Early Baseball | Batting Average, ERA, RBIs | Basic performance tracking |
| Moneyball Era | OBP, SLG, OPS | Efficiency and value |
| Modern Analytics | WAR, wOBA, Spin Rate | Predictive insights and optimization |
These numbers give you a better sense of a player’s overall impact, not just their surface-level results.
Baseball performance analysis is key. You can make quicker, smarter choices, spot players who aren’t getting the recognition they deserve, handle their workloads better, and tweak your strategies on the fly.
According to Stats Perform, analytics are now a widespread (if not universal) part of roster moves and in-game strategy in MLB teams.
Data’s part of winning now, whether you embrace it or not.
Evaluating Player Performance Through Baseball Data

In baseball history, traditional statistics were once the main way to judge performance, but today’s advanced stats provide a much deeper understanding of player value and game strategy.
Learning how to use baseball analytics helps you make smarter lineup choices and improve training. You can measure player performance more accurately now than ever before.
Modern baseball analytics and statistics go beyond the box score, using data to show how each player really helps the team. Tools for baseball data analysis help teams interpret these numbers and make smarter roster and strategy decisions.
Offensive metrics: hitting efficiency, on-base skills, and power
You can track batting performance with key measures like batting average (AVG), on-base percentage (OBP), and slugging percentage (SLG). These stats show how often a batter reaches base and how much power they generate per at bat.
| Metric | Measures | Example Insight |
| OBP | Times on base ÷ Plate appearances | Shows ability to reach base via hits, walks, or hit by pitches |
| SLG | Total bases ÷ At bats | Reflects power and extra-base hits |
| wOBA | Weighted On-Base Average | Balances all offensive outcomes for a fairer value of runs created |
High exit velocity, launch angle, and balls in play data show how well a batter makes contact. They also reveal how often they produce runs batted in or home runs.
These advanced stats highlight performance in ways that traditional statistics never could.
Defensive metrics: fielding range, reaction time, and positioning
Defensive data measures how players stop runs. Tracking weak contact and batted ball outcomes helps evaluate range and reaction.
Fielders with strong positioning reduce errors and boost team efficiency. These insights go way beyond what traditional statistics ever could tell you and are key examples of how modern baseball statistics enhances defensive evaluation.
Pitching analysis: velocity, spin rate, and pitch effectiveness
Pitchers get judged by metrics like Fielding Independent Pitching (FIP), Expected Earned Run Average (xERA), and Earned Run Average (ERA). These stats isolate a pitcher’s skill from what’s going on defensively.
Spin rate, pitch velocity, and ball movement data reveal how effective each pitch is. Tracking high BABIP or independent pitching trends helps spot when luck or defense is skewing results.
The Role Of Performance Analysis In Baseball Player Development

You can use performance analysis to spot a player’s strengths and weaknesses before they show up in the box score.
By comparing data like batting averages, swing paths, and defensive range, coaches see where a player stands against a replacement-level player.
This early insight helps you decide how to adjust a player’s playing time or focus training on specific skill gaps.
Tailoring training programs with data insights
Analytics let you design training sessions that match each player’s ability. Using video tracking and motion data, you can measure how small changes in stance or release point affect performance.
Modern tools, like college baseball analytics, help teams apply these insights quickly. That keeps workouts focused on things you can actually measure and improve.
Tracking progress over a season or career
You can track how players develop over months or years by watching their metrics over time. Trends in swing efficiency, pitch accuracy, or fielding range show whether training is working.
Coaches can use predictive models to estimate future performance. That helps plan roster moves and makes sure players keep improving with the team’s long-term goals in mind.
Monitoring Injury Prevention And Player Health Through Performance Analysis
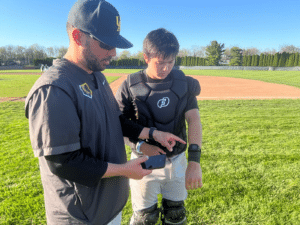
You can use performance data to spot fatigue before it ruins your lineup. Tracking workload, biomechanics, and recovery helps you make decisions that keep athletes healthier and playing better.
Using workload to reduce overuse injuries
By tracking pitch counts, velocity and rest days, you can see when a player’s workload is getting too high. Overuse leads to shoulder or elbow injuries, especially for pitchers.
Example metrics to track:
- Innings per week
- Average velocity
- Days of rest between appearances
Teams that pay attention to these trends can adjust training loads to prevent breakdowns and help players last longer.
Biomechanics and motion capture in injury risk
Modern tools like wearable sensors and motion capture systems record player movements in real time. These systems measure joint angles, arm speed and body rotation to spot mechanical flaws that put extra stress on muscles and ligaments.
If you fix these movement patterns early, you help players maintain efficient form and lower injury risk.
Recovery data for long-term player availability
Performance analysis doesn’t end when the game does. Keeping an eye on things like sleep quality, heart rate variability, and muscle recovery helps you see how players recover after they hit the field.
You can fix their rest schedules and training intensity to keep them feeling fresh and ready to go all season. It’s all about thinking long-term.
Using Baseball Performance Analysis To Inform Team Strategy And Game Management

Baseball performance analysis lets you make smarter choices that really impact game outcomes. By digging into player data and trends, you can spot which matchups work best and know when to shake up your strategy.
This approach gives your team a measurable edge. Over a long season, it can lead to a few extra wins, which is sometimes all you need.
Teams in MLB rely on real-time data from tools like baseball coaching software to boost communication and decision-making.
These systems track pitch results, defensive plays, and player tendencies, so coaches can adjust plans mid-game instead of waiting for post-game reports.
Key uses of performance analysis in team strategy:
| Focus Area | How It Improves Team Play |
| Roster construction | Identifies undervalued players and builds balanced lineups |
| Defensive shifts | Positions fielders based on opponent hitting patterns |
| Pitching decisions | Chooses matchups that reduce scoring chances |
| Lineup optimization | Maximizes run production using predictive stats |
| In-game management | Adjusts tactics instantly using live data |
If you track every pitch, swing, and defensive move, your strategy shifts from reactive to proactive. You start to see how each decision shapes the team’s approach.
It lets you tweak tactics that affect every play and sometimes the whole game.
Read our guide on the baseball scoring software that supports these analytics.
FAQs About Baseball Performance Analysis
What are the key performance indicators for baseball?
You can track a player’s impact using key performance indicators (KPIs) like batting average, on-base plus slugging (OPS), and wins above replacement (WAR). Pitchers tend to focus on earned run average (ERA) and fielding independent pitching (FIP).
These stats help you compare players and make smarter lineup or scouting decisions.
| Category | Common KPI | What It Measures |
| Hitting | OPS | Overall offensive power and consistency |
| Pitching | FIP | Pitcher control without fielding effects |
| Defense | Defensive Runs Saved (DRS) | Fielding efficiency |
| Baserunning | Stolen Base % | Speed, and decision-making on bases |
What is the 80/20 rule in baseball?
The 80/20 rule says that about 80% of a team’s success usually comes from 20% of its players. Data analysis helps you find which players drive most of your wins or runs.
That way, you can focus training and resources where they’ll matter most.
Is a .400 average good in baseball?
Yeah, hitting .400 is ridiculously good. Only a few players in history, like Ted Williams in 1941, have pulled it off.
Today, even a .300 average is impressive since pitchers and defenses have gotten so much better. A .400 average is the all-time elite category.
How to analyze baseball stats?
Start by grabbing reliable data from trusted sources like MLB Statcast. Focus on metrics like launch angle, exit velocity, and wOBA.
Next, fire up tools such as Excel, R, or Python to dig for patterns. With a bit of curiosity, you’ll spot trends that can shape coaching, player development, or even game strategy.
Share This Article
Related Articles



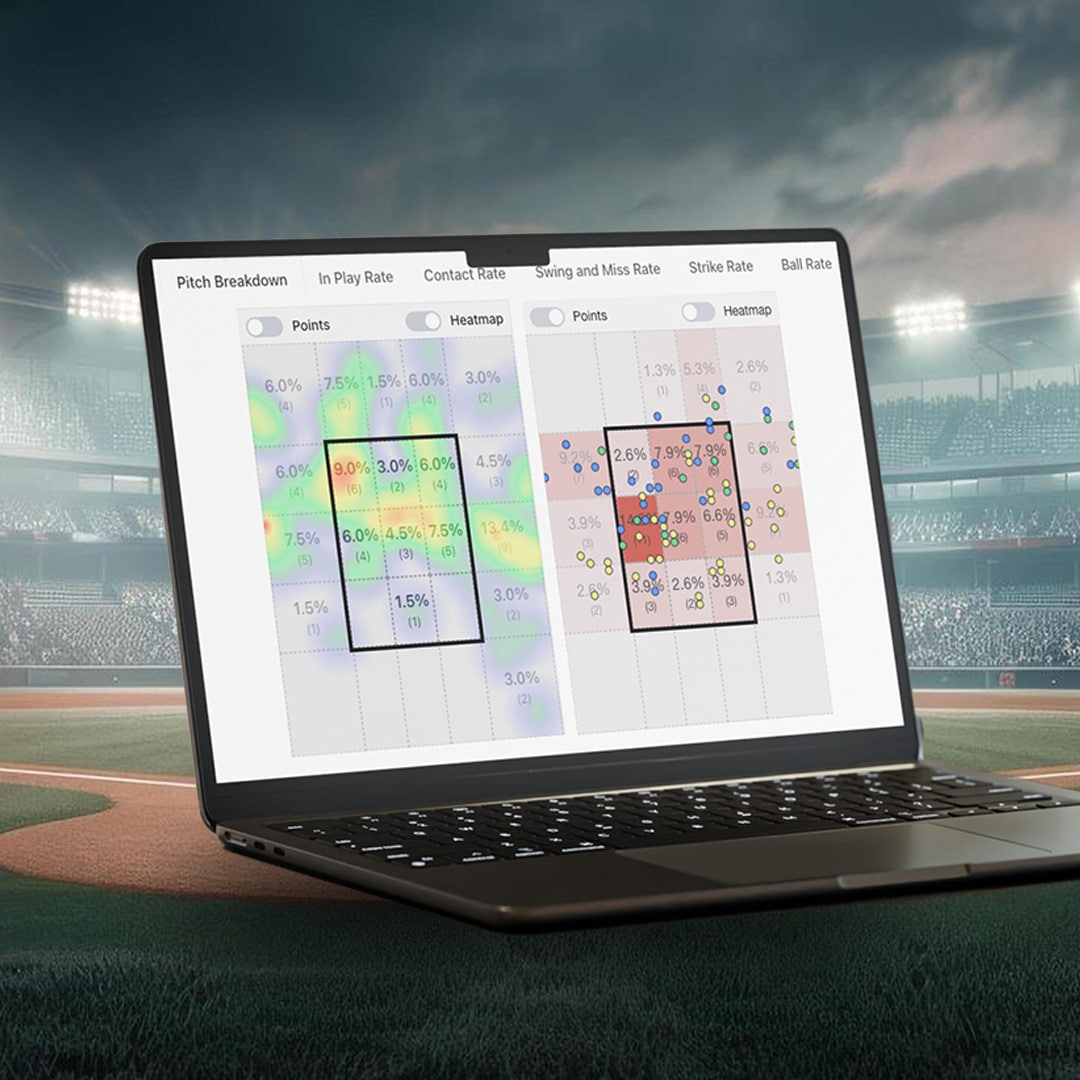
Big-League Analytics in your dugout for free
With GoRout Connect, GoRout Diamond customers receive access to AWRE Sports suite of analytics tools for free!