Softball Game Analysis: How GoRout Connect Empowers Coaches
Reading Time: 10 minutes
Reading Time: 10 minutes
You want every decision on the field to count. Whether you coach high school softball or manage a college program, understanding how to break down each pitch, swing, and play helps you coach smarter.
Softball game analysis with GoRout Connect gives you the tools to see what’s happening in real time and turn that insight into stronger strategy and player development.
By combining communication and analytics, GoRout Connect lets you move beyond guesswork. You can track patterns, adjust defensive shifts, and make data-backed decisions faster than ever.
With technology once reserved for pros now within reach, you can transform your softball program with clear data, connected tools, and smarter preparation.
It is how you turn stats and numbers into a winning plan and communication into consistent performance.
Each part of this article will show how to use modern analysis, from pre-game planning to post-game review, to shape confident, informed coaching choices.
The Basics Of Modern Softball Game Analysis

Modern softball game analysis helps you understand every pitch, swing, and moment that shapes performance.
With tools like GoRout Connect, you can look deeper into data that shows how players move, where they hit the ball, and why certain decisions lead to better results on the field.
You can track both pitching mechanics and swing mechanics in real time. Pitch speed, pitch location, and pitch type reveal how pitchers control the strike zone, while hitting data, like exit velocity and launch angle, highlights how solidly a batter makes contact.
These details help you refine a player’s form or adjust drills to match their strengths.
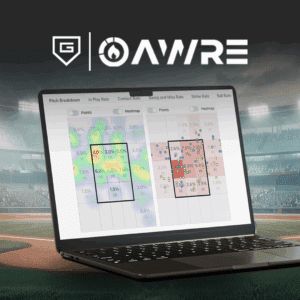
Advanced visual tools turn these numbers into easy-to-read charts. Heat maps show where pitchers attack the zone and where hitters make the most contact. Spray charts display which areas of the field the ball travels to most often.
| Tool | What It Tracks | Why It Matters |
| Strike Zone Maps | Pitch location and pitch type | Tracks command and accuracy |
| Spray Charts | Ball placement and hitting zone | Guides defensive alignments and informs batting adjustments |
| Pitch Intent vs Result | Planned vs actual pitch execution | Highlights consistency and control |
When your softball program uses connected systems like GoRout Connect, you gain automated access to these insights. The software syncs pitch calls, charting data, and performance visuals instantly.
That means you can focus on coaching decisions instead of sorting through spreadsheets, letting technology support your next winning play.
Understanding The Importance Of Game Analysis In Softball
When you analyze a game, you do more than review scores or highlights. You track key moments, player movements, and decision outcomes that show where your team performs well and where adjustments might help. This process gives you a clear view of what’s actually driving success on the field.
Baseball and softball coaches use game analysis to make data-backed decisions. By reviewing measurable details, like pitch speed, contact rate, and defensive range, you see patterns that shape better training sessions and smarter in-game strategies.
Analytics also build player confidence. When athletes see data that confirms their growth, they understand how effort turns into results. You can use that same feedback to guide conversations and set realistic goals that fit each player’s strengths.
Game analysis turns raw statistics into actionable insights you can apply right away. Tracking how pitches or plays develop helps you react faster and plan future matchups with clarity. Modern tools like GoRout Connect make this easy by collecting and displaying accurate information in real time.
| Key Focus | What It Helps You Do | Coaching Benefit |
| Pitch Trends | Spot inconsistent mechanics | Improve accuracy and control |
| Hitting Data | Identify swing timing and contact zones | Refine batting practices |
| Team Metrics | Compare game-to-game performance | Build consistent improvement |
You give your organization an edge when every choice comes from precise, easy-to-understand data that empowers both you and your team.
Using Softball Game Analysis For Pre-Game Preparation And Strategy Building
Before each game, you can analyze both past and live data to understand your opponents’ tendencies. Tools like heat maps and spray charts help you see where opposing hitters make the most contact and which zones they struggle to reach.
This quick insight helps you spot weak points and prepare pitchers to attack more effectively. You no longer rely on guesswork. You have evidence guiding every call.
Setting performance goals for players and teams
Using the data collected from recent practice sessions and previous games, you can set clear, measurable performance goals. These goals may include improving first-pitch strikes, lift in contact percentage, or reduced errors in field coverage.
Example goals:
| Focus Area | Goal | Drill Type |
| Pitching | Improve first-pitch strike rate by 10% | Bullpen command drills |
| Hitting | Increase zone contact rate | Timing and pitch recognition drills |
Each goal connects directly to the numbers captured in your analysis, so progress feels specific and trackable.
Designing defensive and offensive strategies with GoRout Connect
When you use GoRout Connect, your pitch calls and spray data update instantly across devices. It helps you create defensive alignments and offensive plans that fit real player performance.
You can tailor your lineup by reviewing where your hitters place the ball or how your pitchers locate key pitches. This system keeps your team ready and aligned before the first pitch.
Using analytics to anticipate game scenarios
With patterns visible from past games, you can forecast how certain situations may unfold. If a rival hitter struggles against inside fastballs, you can plan to exploit that.
By studying execution rates and pitch intent vs. result data, you can adjust mid-game without delay. This preparation lets you respond to any scenario with calm, informed decisions.
In-Game Analysis & Decision Making With Real-Time Data
GoRout Connect gives you instant access to performance information as each play unfolds. You can see every strike, hit, and miss translated into clear visuals that update in seconds. It helps you react faster without guessing.
The system combines pitch and charting data from connected devices, turning it into real-time feedback you can use right in the dugout. You stay focused on coaching, while the data keeps you informed about changing game dynamics.
| Tool | What It Shows | Coaching Use |
| Strike Zone Maps | Pitch accuracy by zone | Identify hot and cold spots |
| Spray Charts | Where hits land | Track hitters’ tendencies |
| Pitch Intent vs. Result | Execution accuracy | Adjust pitch selection |
With the strike zone map, you can tell exactly where your pitcher hits each corner and whether the plan matched the outcome. When you notice a pattern, like repeated misses on a certain pitch, you can adjust placement or pitch type right away.
Spray charts highlight where hitters make contact, so you can set your defenders more effectively. You learn which zones produce grounders or line drives, helping you manage defensive shifts with confidence.
Real-time updates also make teamwork easier. Coaches and catchers can share quick notes about pitch calls or field placement during the game. Every player stays aligned, and your strategy remains flexible as new data rolls in.
Post-Game Analysis And Performance Review
After a game, you can use GoRout Connect to quickly revisit key plays that shaped the outcome. Reviewing moments like missed pitches or solid defensive stops gives you actionable insights into what worked and what didn’t. These reviews help your team reflect and build consistent habits across the season.
Reviewing player statistics and trends
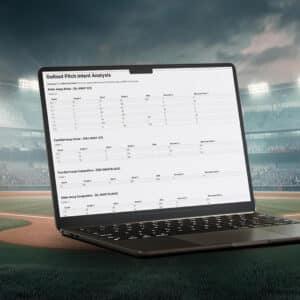
With synced data from the AWRE Sports system, all your pitch calls and results appear automatically. You can view stats like pitch execution and hit locations in one dashboard. It makes it easy to identify strengths and track individual progress without sorting through notes or charts manually.
| Metric | What It Shows | Coaching Use |
| Strike Zone Accuracy | Location consistency | Fine-tune control and placement |
| Spray Chart Data | Where hits land | Adjust fielding alignment and batting approach |
| Pitch Intent vs Result | Execution quality | Plan bullpen training focus |
Identifying improvement areas through data visualization
Heat maps and spray charts turn performance data into simple visuals that are easy to read. You can see which parts of the strike zone pitchers do well in and which areas they need to control better. These visuals make strengths and weaknesses easy to spot and help create better improvement plans for both players and the team.
How GoRout Connect simplifies post-game reporting
Instead of compiling reports by hand, the platform delivers organized summaries right after each game. You get a clean overview of performance, ready for review in your next meeting. It helps you prepare targeted drills and keep progress steady from game to game.
Video And Data Integration For Deeper Softball Game Analysis
You can strengthen your coaching by matching recorded video with live metrics. When you pair slow-motion playback or swing analyzers with data tools like GoRout Connect, you see what swings or pitches look like and how they perform statistically.
A single clip of game footage tells more when numbers like pitch speed, strike location, or contact rate appear beside it.
Tagging and categorizing plays for efficient review
With connected tools, you can record a play, label it, and easily find the video later when you need it. Video systems let you sort clips by things like pitch type, pitch count, or the result of the play. Tagging details such as bunts, grounders, or line drives makes post-game review much faster and helps you spend more time improving instead of digging through files.
| Tag Type | Example Use | Coaching Benefit |
| Pitch Type | Riseball, Curve | Track success by pitch selection |
| Swing Result | Flyout, Single | Link contact type to batting strategy |
| Defensive Play | Double play, Error | Reinforce fielding awareness |
Using GoRout Connect to sync video data with performance metrics
GoRout Connect links your camera and AWRE Sports charting system so every pitch or swing can sync automatically. You don’t need to merge files or enter stats manually. This connection brings real-time video and data integration to your dugout, combining heat maps, spray charts, and pitch results in one dashboard.
Enhancing player understanding through visual feedback
Players often learn best when they can see what happened. Using drawing tools to mark movement paths or highlight the strike zone on video makes complicated feedback easy to understand. Watching their own clips in slow motion helps players connect performance data with mechanics they can actually change.
Turning Game Analysis Into Player Development

When you track progress over time, patterns in your athletes’ performance become clear. GoRout Connect pairs with charting tools to show where pitches land, what areas hitters target, and how results change from game to game. These visuals help you see which specific areas need focus and where steady improvement is happening.
| Data Type | What It Shows | How It Helps Development |
| Pitch Maps | Strike zone coverage | Reveals command consistency |
| Spray Charts | Ball contact patterns | Points out hitting tendencies |
| Execution Data | Pitch intent vs. result | Shows success rates by situation |
Creating personalized training programs
Instead of general drills, you design training that targets weak spots. A pitcher working on command in one zone and a hitter adjusting swing timing get very different development plans, both supported by real data.
Encouraging player accountability through measurable goals
Numbers make feedback easier to understand. Players can track their own performance charts to see improvements and challenges. When they notice clear progress, motivation grows naturally, and they take more ownership of training goals.
How GoRout Connect supports continuous improvement
You don’t have to log or compile everything manually. Each game automatically records the data you need to guide growth. With up-to-date insights at your fingertips, you refine skills faster and keep every athlete moving forward in their development plan.
Implementing GoRout Connect In Your Softball Game Analysis
Getting your team set up with GoRout Connect starts with clear goals. What data do you want to track? Pitch accuracy, swing contact, defensive positioning? Once you have your priorities set, this powerful tool will collect, organize, and review that data in one place. No more hours of paperwork.
To get the most out of the software, train your coaching staff and players to use it. Show each person how to read charts, watch synced videos and understand data visuals.
A quick walkthrough before games will save time later. Players will quickly see how their performance translates into measurable results, and that will boost communication and confidence.
Integration with your current technology is simple. GoRout Connect syncs with tablets, smartphones, and charting apps so you don’t have to change your entire setup. It connects pitch-calling, video analysis, and performance tracking into a single coordinated system.
| Step | Action | Benefit |
| 1 | Connect GoRout devices | Share real-time data with coaches and players |
| 2 | Sync existing analytics tools | Avoid duplicate work and manual entry |
| 3 | Review game performance after each match | Identify trends and develop strategy |
As you start using these tools, check how they impact your outcomes. Track how much time you save on manual tasks and look at injury prevention data. These results show how GoRout Connect helps your team improve over time and brings real value to your softball program.
Conclusion About Softball Game Analysis
Softball game analysis gives you a clear view of how every play shapes your team’s success. When you track data like pitch speed, hitting zones, and fielding range, you can make practical choices that improve results over time. You start to see patterns that guide smarter training and lineup decisions.
Using software such as GoRout Connect makes it easier to collect and use this information. It combines real-time communication, data tracking, and interactive dashboards so you can focus more on coaching and less on manual tasks.
Each pitch, swing, and fielding attempt becomes part of a bigger picture that helps you adjust strategy with confidence.
You can act on live information instead of waiting until after the game. It leads to faster adjustments and clearer feedback for your players. GoRout Connect keeps all your data in one place, so coaches, players, and staff stay on the same page and see the same information in real time.
Key benefits include:
- Quick, data-backed decisions during games
- Easier player development tracking
- Reduced time spent on manual charting
- Better team communication and consistency
By bringing technology and teamwork together, you can turn every stat into a learning opportunity. If you’re ready to strengthen your program and simplify your coaching process, get a quote for GoRout Connect today.
FAQs About Softball Game Analysis
What is the Cinderella rule in softball?
The Cinderella rule in softball refers to a batting order system where all present players are included in the lineup, with late arrivals added at the end, ensuring everyone gets to bat regardless of arrival time.
What are the top 3 hardest positions in softball?
Many players agree that pitcher, catcher, and shortstop are the toughest.
The pitcher works under a lot of pressure and needs precision, stamina, and accuracy. They control the speed of the game, make quick decisions, and use different pitching styles.
The catcher leads the defense by calling pitches, blocking balls, and coordinating with the infield. This position requires strong awareness, agility, and great communication.
The shortstop fields some of the hardest-hit ground balls, helps turn double plays, and guides many defensive movements in the infield. They need quick reactions, agility, and a strong throwing arm.
What is 70 mph in softball equal to in baseball?
A softball pitch at 70 mph travels a much shorter distance than in baseball. It’s roughly equal to a baseball pitch at 90 mph. The reaction time for a batter is nearly the same, which shows how fast elite softball pitching truly is.
What is the 20-second rule in softball?
The 20-second rule limits the time between pitches. Once the ball is ready, the pitcher has 20 seconds to throw. It keeps the game moving and encourages a steady rhythm during play. It also helps both teams stay focused and maintain game pace.
Share This Article
Related Articles


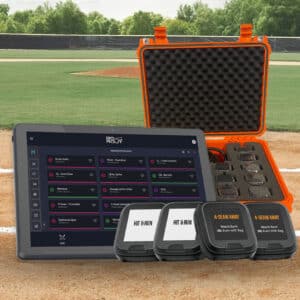
Big-League Analytics in your dugout for free
With GoRout Connect, GoRout Diamond customers receive access to AWRE Sports suite of analytics tools for free!