How to Use Analytics in Baseball for Competitive Success in 2026
Reading Time: 10 minutes
Reading Time: 10 minutes
If you want to be competitive in 2026, you need to use analytics in baseball to make smarter, better informed decisions. Instincts alone won’t cut it.
From the roots of baseball history, where baseball statistics began with simple box scores, to today’s advanced models driving team strategy, analytics has always been central to the game’s evolution.
Applying data to evaluate players, shape lineups, and tweak strategies gives your team a real edge over the competition.
Analytics in baseball has expanded past batting averages and ERA. Now you can track exit velocity, spin rate, defensive range, and player movement as it happens.
In this guide, we will explain how analytics in baseball gives you insights that help you recruit better, prevent injuries, enhance decision-making, and boost on-field performance.
What Are Analytics In Baseball

Baseball analytics is all about using data analytics to study performance, strategy, and player value. Instead of looking at batting average or RBIs, analytics digs into what’s really driving outcomes and how to improve them.
This approach, often called sports analytics, goes beyond box scores. Performance data allows you to spot patterns in pitch movement, defensive setups, and player efficiency in a way that traditional stats can’t compare.
By using statistical analysis, you get insights that help you make smarter calls in the field and when building your roster.
The roots of analytics go back to sabermetrics, which challenged old ideas about player value.
Now, advanced baseball statistics show you real-time data on exit velocity, launch angle, and sprint speed.
Some standard metrics include:
- WAR (Wins Above Replacement): Measures a player’s total value compared to a replacement-level player.
- wOBA (Weighted On-Base Average): Shows offensive value more accurately than batting average.
- FIP (Fielding Independent Pitching): Evaluates pitchers on outcomes they directly control.
Every team now uses advanced analytics to sharpen decisions. From lining up the batting order to shifting the defense, these insights can give you a leg up.
Understanding Key Metrics In Baseball Analytics
Analytics in baseball lets you measure performance beyond the old-school stats. Advanced metrics paint a clearer picture of how players help win games at bat, on the mound, or in the field.
These numbers help you compare players to the league average and make better decisions.
Offense metrics: wOBA, OPS+, batting average, exit velocity
Batting isn’t just about batting average anymore. On-base percentage (OBP) and slugging percentage (SLG) show how often a player gets on base and what kind of power they bring.
Weighted on-base average (wOBA) values different results more accurately than batting average. OPS+ adjusts on-base plus slugging for league and park, so you can compare players more fairly.
Tracking exit velocity and launch angle shows how hard and at what angle a ball leaves the bat. These stats predict future success better than simple hit totals.
If you want to dive deeper, check out this baseball analysis guide.
Pitching and defense metrics: FIP, WAR, pitch framing, route efficiency
For pitchers, fielding independent pitching (FIP) focuses on strikeouts, walks, and home runs.
Expected earned run average (xERA) goes a step further by predicting outcomes based on contact quality.
On defense, defensive plays and route efficiency measure how well fielders track down balls. Catchers add value by pitch framing (measured by Catcher Framing Runs [CFR]), turning borderline pitches into strikes.
Wins Above Replacement (WAR) compares a player to a replacement-level player, showing total value across offense, pitching, and defense.
Tracking pitch speed, spin rate, and release point gives you a deeper look at pitching, too.
Data Collection Methods And Technology In Baseball Analytics
You can’t use analytics without solid data collection. Baseball always tracked stats like those found in box scores, but today’s tech goes way beyond runs, hits, and errors.
Baseball teams now gather millions of baseball data points every game, giving you a much clearer view of player performance and trends.
Tracking systems like Statcast, PITCHf/x, radar & video capture
Modern systems, such as Statcast and PITCHf/x, record every pitch, swing, and batted ball in real-time. Radar and high-speed cameras measure spin rate, launch angle, and exit velocity.
This detail lets you compare results across stadiums and seasons with more precision than old stats ever could.
Now you can ditch the guesswork. Instead of reading scouting reports, you can see how often a hitter makes solid contact or how a pitcher’s movement stacks up against league averages.
Wearable sensors, biomechanical analysis, and motion data
You can track player data straight from the body, too. Wearable sensors grab info like workload, heart rate, and joint stress during games and practices.
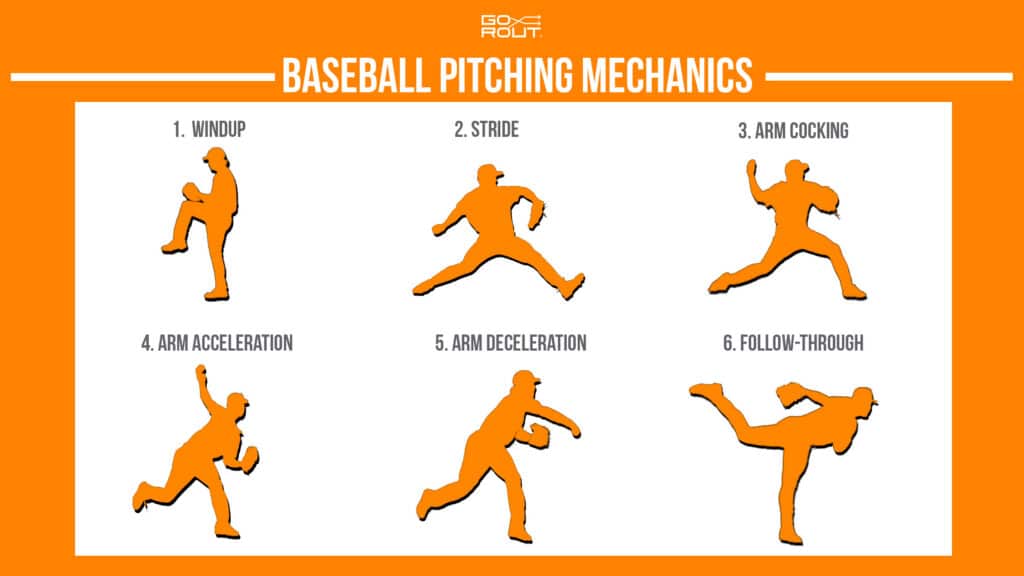
Motion analysis lets you study pitching mechanics or swing paths, offering clues to reduce injuries and boost efficiency.
These tools help with both performance and health. When you combine biomechanical data with game stats, you can spot patterns that might predict fatigue or injury.
Coaches now use AI-powered baseball analytics tools to connect all this info with in-game strategy.
Using Analytics In Baseball For Player Evaluation And Scouting
Analytics lets you evaluate players better than old-school stats. By seeing past performance, playing time, and individual results, you get a better idea of what a player can bring.
It helps you:
- Measure consistency across seasons
- Compare players at the same position
- See strengths and weaknesses
- See how skills translate to higher levels
It helps Major League Baseball (MLB) teams, minor league, college, and other levels of play make smarter scouting choices.
Teams like the Oakland Athletics and Boston Red Sox have built rosters with data-driven evaluation, and the New York Yankees use advanced models to compare average players with top talent.
Today’s scouting blends traditional observation with data. When you evaluate players, you can use both video analysis and performance metrics to back up what you see.
| Factor Analyzed | Why It Matters |
| Player’s playing time | Reveals durability and reliability |
| Past performance | Shows trends and growth potential |
| Individual performance | Highlights unique strengths |
| Contextual stats | Adjusts numbers for park or league effects |
This mix helps you spot talent others might miss and lowers the risk of a bad pick.
The Role Of Analytics In Game Strategy, Tactics, And Decision Making

You can use analytics to shape game strategy from the first pitch to the last out. Data helps you know when to push, when to hold back, and how to manage risk.
It gives your team a plan that isn’t based on gut feelings.
Key areas where analytics guide decisions:
- Lineup construction
- Defensive positioning
- Pitch selection
- Substitution timing
By studying player matchups, you spot advantages that aren’t obvious. Maybe a hitter struggles with a certain pitch, or a pitcher dominates lefties.
These insights help you build smarter game plans and adjust as the game unfolds. During live play, analytics support quick adjustments. Tools like baseball coaching software let you review real-time data and tweak decisions, whether that means shifting fielders or swapping pitchers.
This keeps your strategy flexible. You can also use data to understand win probabilities in different scenarios.
Knowing the odds for a bunt, steal, or hit-and-run helps you weigh the risks. That way, you base calls on numbers.
Analytics also improves communication in the dugout. Coaches and players use shared metrics to get on the same page. When everyone gets the numbers behind the moves, your team plays with more confidence.
GoRout Connect And Its Baseball Analytics Technology
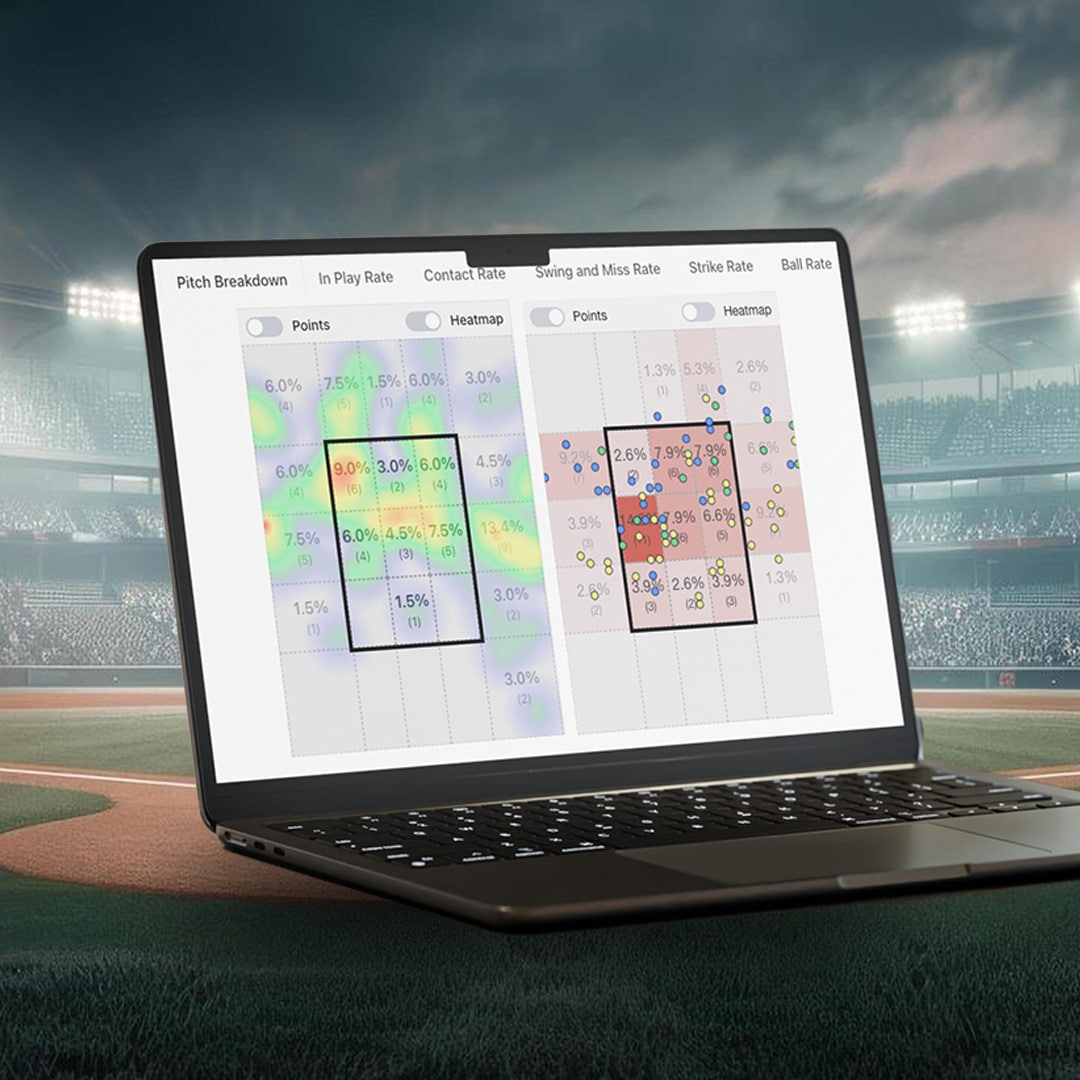
GoRout Connect brings advanced baseball analytics right into your dugout. Pair the GoRout Diamond with the AWRE Sports charting app, and you can track every pitch and chart results automatically.
Review data instantly, without needing extra steps or complicated software. Once you sync your pitch library from your GoRout tablet, every call and outcome flows straight into the system.
This setup saves time and boosts accuracy. You get to focus on coaching.
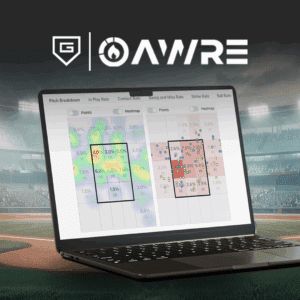
Key features include:
- Strike Zone Maps that show pitch locations and highlight hot and cold spots.
- Baseball Spray Charts that reveal where hitters put the ball in play.
- Pitch Intent vs Result reports that measure execution against your plan.
- Automatic syncing and instant reports delivered straight to you after games.
These tools show how your pitchers attack hitters and where you might need to adjust. See patterns as they happen and decide exactly what to target in practice.
It’s a data-driven approach that fits right into your coaching flow.
With GoRout Connect, you get insights that usually require expensive systems. Make smarter bullpen plans and refine pitch strategies with confidence.
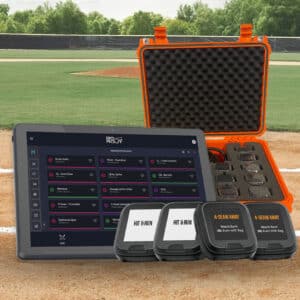
If you want pro-level analytics on your team without changing your coaching style, get a quote today.
Using Analytics To Monitor Athlete Health, Injury Risk, And For Performance Optimization
You can use analytics in baseball to track health, cut injury risk, and boost performance. When you combine performance analysis with machine learning and artificial intelligence, you get insights that help shape training and player development.
Load management, recovery metrics, biomechanical risk factors
Tracking workload helps you manage how much stress players handle in games and practices. Data on pitch counts, sprint speeds, and recovery times shows when someone needs a break.
Biomechanical monitoring adds another layer. Motion tracking spots risky movements that could turn into injuries. You can adjust mechanics before trouble starts.
| Metric Type | Example Data Points | Benefit |
| Workload | Pitch count, innings | Prevents overuse |
| Recovery | Heart rate, sleep quality | Improves readiness |
| Biomechanics | Arm angle, stride length | Reduces injury risk |
Tracking fatigue, preventing overuse, optimizing training
Analytics make it easier to notice when players are getting tired. If their reaction time is slow or they’re not throwing as hard, you can ease up on their practice and keep them from burning out.
With baseball performance analysis tools, you can track progress over time, see which drills actually help, and avoid the ones that wear players out.
By using predictive models, you can prevent overuse injuries and still keep athletes developing. It’s all about finding that sweet spot between pushing for improvement and keeping everyone healthy.
Challenges, Limitations, And Ethical Considerations For Analytics In Baseball

Baseball analytics can be tricky. Using advanced stats can help you make better decisions, but they also come with bias, misreading the data, and ethical issues for the players and teams.
Data quality is a big hurdle. Inaccurate tracking systems or incomplete datasets can lead to bad conclusions. If you overfit models to past seasons, you might get numbers that look great but flop in real games.
Bias in player evaluation also creeps in, especially if models lean too much on traditional statistics or ignore certain roles.
The statistical revolution, led by Bill James and the American Baseball Research Journal, challenged old assumptions, but even modern tools can hide biases.
Cost and access create real gaps between teams. Wealthier teams can buy advanced tracking systems and hire analysts, while smaller market teams can’t keep up. This imbalance affects the whole league.
Ethical considerations also matter:
- Player privacy: Wearables and biometric data can reveal sensitive health info.
- Transparency: If coaches or front offices hide how models work, players will lose trust.
- Sign stealing: Using data tools to gain an unfair advantage is cheating.
For more context, check out the Society for American Baseball Research for studies on baseball analytics history and ethics.
Best Practices For Teams Adopting Analytics Successfully
You get a real competitive advantage when your team has the right culture around analytics. Coaches, players, and staff need to understand why data matters.
When you encourage data literacy and build trust, players are more likely to use insights instead of pushing back. Coach buy-in is huge. If your coaching staff supports analytics, players usually follow.
Share real examples of how numbers improve performance. When you connect metrics to outcomes, such as on-base percentage or pitching efficiency, you make the data matter.
Choosing the right tools is just as important as culture. You don’t need the fanciest software. Use tools that fit your workflow.
Train your staff to use them daily. Consistency builds habits, and good habits make analytics part of your routine.
Here’s a simple table to set expectations.
| Focus Area | What To Do | Why It Helps |
| Tools & Training | Pick user-friendly platforms and train staff | Ensures adoption across all levels |
| Daily Integration | Embed analytics in scouting, practice, and games | Makes data part of decision-making |
| Clear KPIs | Define metrics like pitch velocity, exit velocity, and recovery time | Tracks progress and ROI |
| ROI Measurement | Compare performance gains to resource spend | Proves value of analytics investment |
Defining key performance indicators (KPIs) keeps your program honest and focused. Track both player development and team outcomes.
When you measure return on investment, you can show ownership and fans that analytics really do support winning.
Conclusion About Analytics In Baseball
Now you can see how analytics has changed every part of baseball from scouting and player development to in-game strategy. By using data you make better decisions, reduce guesswork and give your team a measurable edge.
Key takeaways include:
- Smarter recruiting with advanced stats like WAR and wOBA
- Improved pitching plans using predictive models and pitch tracking
- Better defense through shifts and player positioning data
- Fan engagement with real-time metrics and visual tools
Analytics also helps you save time by focusing on what truly impacts wins. Instead of relying only on tradition, you can combine proven data with coaching instincts to get the best results.
Solutions like GoRout Connect make this process easier. You can deliver real-time data, communicate faster with players, and adjust strategies on the fly, all without slowing down practice or games. It keeps your team aligned and ready to compete.
If you want to stay ahead in 2026, now is the time to act. Start applying analytics to your program, explore reliable tools, and build a system that supports both coaches and players.
Get a quote for GoRout Connect and see how it can fit into your team’s workflow.
FAQs About Analytics in Baseball
What are analytics in baseball?
Analytics in baseball means using data to make better decisions on the field and in team operations. You use numbers to measure player performance, guide strategy, and even plan scouting.
Every Major League Baseball team now relies on analytics to stay competitive.
What are the statistics used in baseball?
You see both traditional stats and advanced metrics:
- Batting Average (AVG): Hits ÷ At-bats
- On-Base Percentage (OBP): Times on base (hits + walks + hit by pitch) ÷ Plate appearances (at bats + walks + hit by pitch +sacrifice hits)
- Slugging Percentage (SLG): Total bases (# of singles + # of doubles [x2] + number of triples [x3] + number of home runs [x4]) ÷ At-bats
- Wins Above Replacement (WAR): Overall player value
- Fielding Independent Pitching (FIP): Pitcher performance without fielding factors
These stats help you evaluate skills more accurately than box scores alone.
How much do baseball analysts make?
Baseball analyst salaries really depend on the role and the team.
According to ZipRecruiter and as of September 26, 2025, baseball analysts in the U.S. are earning around $97,659 a year, which breaks down to about $46.95 an hour. That works out to around $1,878 a week or $8,138 a month.
If you know coding, data visualization, or machine learning, you can bump up your value quite a bit. Those extra skills really matter these days.

