Baseball Data Analysis And Strategies for Winning on the Field
Reading Time: 9 minutes
Reading Time: 9 minutes
In baseball history, instincts and gut feelings were the deciding factor behind key moves. Now, it’s a game powered by data and smarter choices, with analytics transforming the sport and changing how teams compete at every level.
Modern teams rely on advanced stats to evaluate players and plan strategies. They provide the foundation for modern analytics, shaping almost every decision, from roster moves to split-second calls that can determine a game’s outcome.
Teams that embrace baseball analytics get a real edge over those stuck in old-school thinking. They can find undervalued players, precisely position defenders, and achieve extra wins.
This guide explores core baseball data analysis concepts. You’ll learn how to build winning rosters and use real-time technology for better strategy, blending data with classic baseball instincts.
Why Baseball Data Analysis Is Key For Winning

Data analysis changes how you evaluate players and make decisions. Teams using advanced metrics gain an edge by making smarter calls on lineups, trades, strategy, and tactics.
Traditional scouting leaned heavily on gut and conventional statistics like batting average. Now, teams combine those observations with deep performance data for a clearer view of player value.
Analytics help you spot hidden value in players that others ignore. The Oakland Athletics’ “Moneyball” strategy proved you can win on a budget by targeting undervalued skills through innovative use of analytics.
Data shows which strategies work. Instead of guessing, you see which shifts are most effective or which batting orders produce the best results.
Key areas where analytics in baseball make a difference:
- Player evaluation: Advanced stats go beyond the basic numbers and give you a better way to evaluate players by using data-based methods.
- In-game decisions: Data leads pitching changes, defensive moves, and pinch-hitting choices
- Roster construction: You can learn which player combos click
- Injury prevention: Tracking workload and movement helps keep athletes healthy
The biggest edge comes when you mix traditional statistics with analytics. That’s how you gain a deeper understanding of the game beyond the score, evaluating why the outcome occurred and what you need to change.
Core Concepts Of Baseball Data Analysis
The historical use of the box score laid the foundation for modern baseball statistics, enabling the objective recording of game data.
Pioneers like Bill James and Pete Palmer have driven the development of advanced sabermetric stats.
Pitching metrics
- ERA (Earned Run Average) is a foundational stat in baseball that measures a pitcher’s effectiveness by calculating the average number of earned runs allowed per nine innings
- FIP (Fielding Independent Pitching) focuses on outcomes only the pitcher can control, like strikeouts, walks, and homers. It removes any result outside of the pitcher’s control like defensive performance or luck.
- xFIP is an adjusted variation of FIP that uses projected home-run rate instead of actual home runs allowed
- SIERA (Skill-Interactive Earned Run Average) serves the same purpose as FIP, removing any outcomes outside of the pitcher’s control, but considers balls in play and adjusts for the type of ball in play.
- K/9, BB/9, HR/9 show strikeouts, walks, and home runs allowed per nine innings
- Expected Earned Run Average (xERA) uses Statcast data to predict a pitcher’s future performance by analyzing contact quality and isolating pitcher skill from defensive effects
Hitting metrics
- Hits and home runs are essential components in evaluating offensive metrics, while reaching base is a critical offensive skill for producing runs.
- wOBA (Weighted On Base Average) assigns a run value to each hitting outcome to account for how a player reached base versus simply reaching base. It’s a key measure of batting performance.
- wRC+ (Weighted Runs Created Plus) estimates a hitter’s offensive contribution in terms of runs while accounting for external factors like the ballpark or league.
- BABIP (Batting Average on Balls in Play) calculates a player’s batting average solely on balls hit into the field of play. This removes any outcomes that aren’t affected by the opposing defense like home runs or strikeouts.
- ISO (Isolated Power) subtracts batting average from slugging to show raw power, accounting for only extra-base hits including home runs.
- OPS+ (On-base Plus Slugging Plus) is a variation of OPS (On-Base Plus Slugging), which is the sum of a player’s on-base and slugging percentages, that accounts for external factors like league or ballpark.
These baseball analytics tools help you spot real talent. Launch angle and exit velocity data from new tracking systems bring even more detail, providing specific, granular information on the total number of plays, hits, and outcomes tracked across MLB.
Statistical analysis now includes advanced metrics like expected ERA based on contact quality, surpassing basic stats and results. This data revolution changed how teams build rosters and make decisions in Major League Baseball and other leagues.
Using Baseball Data Analysis To Build A Winning Roster
Data uncovers hidden gems that traditional scouts might miss. Digging into underlying metrics beats looking at surface-level stats.
Baseball performance analysis highlights patterns that predict success. Scouting reports now include things like exit velocity, launch angle, and defensive range.
Comprehensive player profiles go beyond batting average. You check how each player contributes in different ways:
- Defensive skills from range and error stats
- Clutch performance under pressure
- Durability and injury history
- Age curves and decline projections
Draft decisions get smarter with predictive modeling. You can forecast which prospects will outplay the average player at their spot.
Development programs use data to target weaknesses. Pitchers get training tailored to their spin rates and release points.
Strategic decision-making in real-time
Game-time decisions need instant data. Managers use real-time stats to decide on defensive shifts and matchups.
Bullpen management gets sharper, with less guesswork. You know which reliever matches up best with different hitters.
In-game adjustments happen fast with live data. Player metrics update in real time, so you can make smart subs before things go south.
This immediate feedback helps you stay ahead. Your team wins by making quicker, better calls.
Technology For Real-Time Data Analysis In Baseball

Modern tech lets you capture every detail as the game unfolds. Real-time data gives instant insights into player movements, pitches, and situations.
Statcast technology tracks everything during live games. It measures batted ball velocity, launch angles, and defensive positions in seconds.
Advanced radar systems record pitch details like spin rate, release point, and ball movement right away.
Digital tools keep data collection easy for coaches and analysts. Baseball coaching software organizes real-time info into useful takeaways.
Key technologies changing baseball analysis:
- Doppler radar for pitch tracking and speed
- High-speed cameras for release mechanics
- Wearable sensors for player movement and fatigue
- Mobile apps for instant play-by-play data
- Cloud platforms to process game data automatically
You can pull up game data right after each play. No more waiting hours for old-school analysis.
Communication speeds up when the whole staff sees the same real-time stats. Pitching coaches watch spin rate changes, hitting coaches track exit velocity, all at once.
Efficiency jumps. Modern baseball scoring software connects everyone with shared dashboards. Trainers, managers, and coaches can all see the info they need, improving efficiency and collaboration.
You can make instantaneous decisions during the game with live data streams.
GoRout Connect: Changing Communication And Strategy
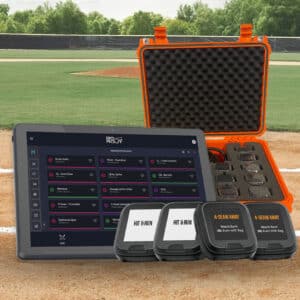
GoRout Connect changes how coaches analyze and share strategy. It combines the GoRout Diamond communication system with the AWRE Sports charting app, giving teams pro-level analytics automatically through their existing pitch-calling process.
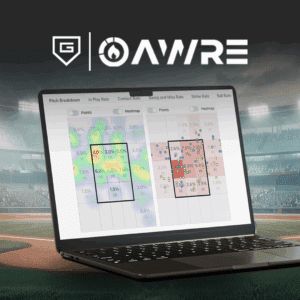
The system syncs your GoRout Diamond pitch library with AWRE Sports via a quick opt-in on your tablet. All your pitch calls are logged and broken down, so you can save time and easily get performance details without any extra work.
Key features
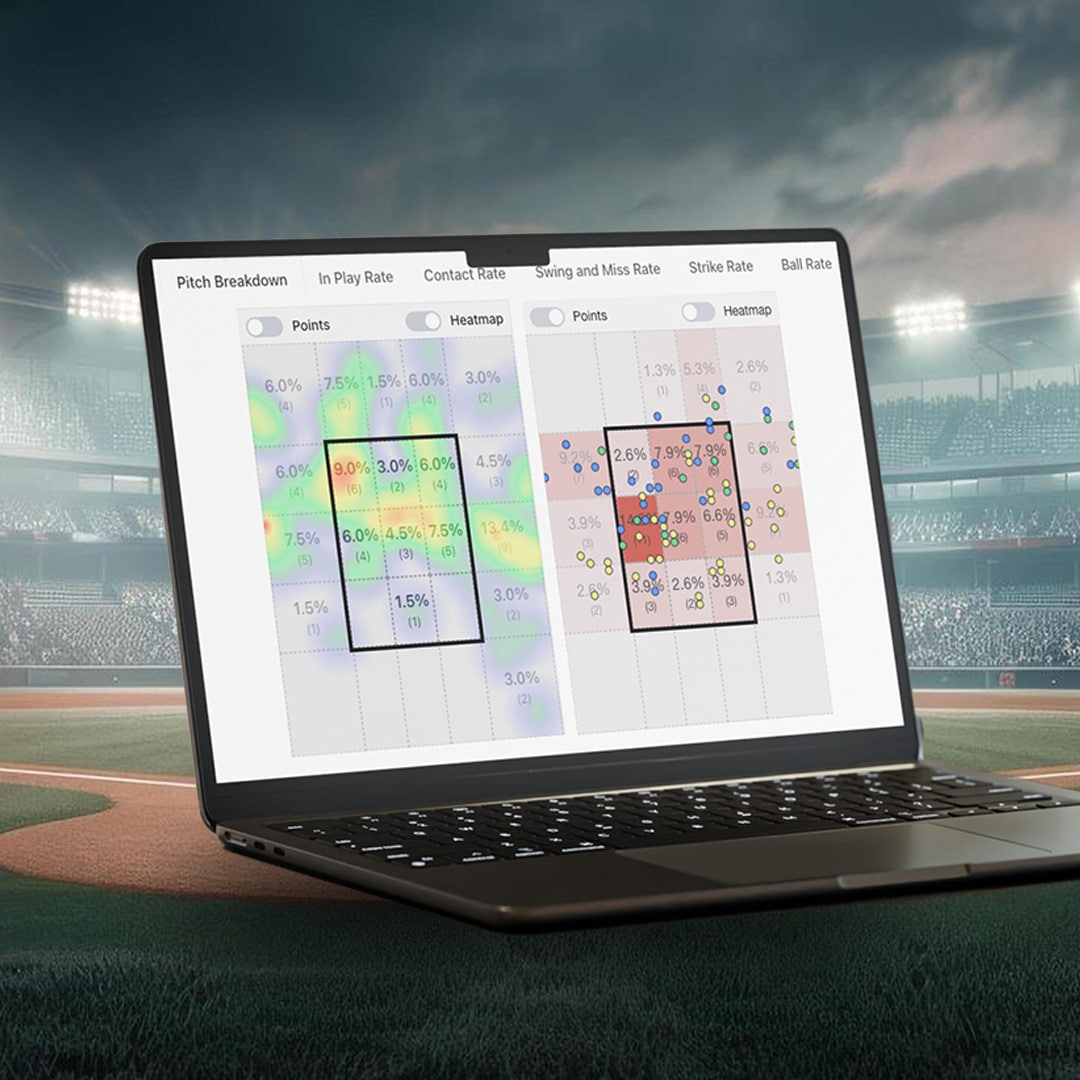
- Strike Zone Maps: See pitch location percentages and heat maps
- Baseball Spray Charts: Track where batted balls land and which pitches get hit
- Pitch Intent vs Result: Check how well pitchers execute your plan
- Automatic Reports: Delivered to your inbox after each game
You get visual displays showing where pitchers attack the strike zone most. Heat maps highlight effectiveness by location and pitch type, making it easier to spot what needs work.
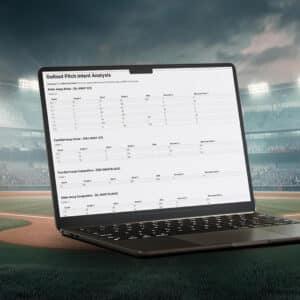
Spray charts reveal which pitches hitters handle best. You can filter the data to catch patterns in balls put in play.
The pitch intent vs result feature tracks execution without manual charting. You get a detailed analysis with almost no extra work.
All GoRout Diamond customers get free access to AWRE Sports charting. Pro-level analytics come to every team without extra cost or headaches.
Thinking about upgrading your team’s communication and strategy?
Get a quote and give GoRout Connect a shot.
The Art Of In-Game Strategy: Merging Data With Instinct
Modern baseball strategy is all about mixing analytics with gut instinct in big moments. Data is the foundation, but instincts help you read what the numbers miss, like momentum, confidence and body language.
Every inning, you face choices that need both stats and awareness. Analytics might say a hitter struggles against lefties, but maybe you see he’s locked in today.
Key factors to weigh during games:
- Matchup data: How specific pitcher-batter matchups have played out
- Game flow: Momentum and team energy
- Player condition: Fatigue and recent trends
- Environmental factors: Weather, crowd noise, foul territory size
Smart managers check their tablets between innings, but also watch body language and listen to their veterans. Numbers might say steal, but if the catcher’s got a strong arm, maybe you hold up.
Data is powerful, but you can’t ignore the human side. Players aren’t robots. They get hot, go cold, and react to pressure in ways spreadsheets and data can’t always predict.
You win games by spotting opportunities with analytics, then using baseball instincts to execute. The real art is knowing when to lean on the numbers and when to trust your gut.
The Future Of Baseball Data Analysis And Technology

Baseball’s tech evolution is about to change how you look at player performance and team strategy.
In the next 10 years, AI will start predicting injuries in advance, and real-time biomechanical data will adjust every pitch and swing on the fly.
Machine learning revolution
You’ll see AI in baseball systems processing thousands of variables at once.
Teams will use predictive models that factor in weather, pitcher fatigue and matchup history. Managers will get real-time strategy advice for every big decision, like having a supercomputer in the dugout.
Wearable technology advances
Smart jerseys will track muscle tension, heart rate and joint stress during games. Players will adjust their mechanics on the fly based on instant biometric feedback.
Pitchers will get pitch suggestions on their smartwatches. Catchers will see advanced scouting reports through AR displays in their masks.
Enhanced fan experience
Virtual reality will let you jump into the game from any player’s perspective. As you watch, interactive stats will pop up on your phone showing probabilities for each at-bat.
Data integration evolution
Systems will start combining traditional sabermetrics with emotional intelligence data. Stress levels and confidence metrics will actually inform tactical decisions.
Teams will turn to quantum computing for scenarios that stump today’s tech.
Conclusion About Baseball Data Analysis
Baseball data analysis has gone from simple stats to powerful decision-making tools that give teams a real edge. Modern analytics help you understand player performance, injury prevention and strategic planning like never before.
The evolution from basic batting averages to advanced metrics shows how far we’ve come:
- Better player evaluation and recruitment
- Injury prevention through motion analysis
- Defensive positioning strategies
- More accurate performance predictions
Technology like Statcast and machine learning is pushing the boundaries of performance. These tools help you see beyond the traditional stats to get to the real story behind player performance.
The best teams combine data with human insight. Numbers provide the foundation, but experienced coaches and scouts add context that computers can’t capture.
Your understanding of baseball analytics opens doors to a deeper game appreciation. Whether you’re coaching, playing or managing a team, data-driven strategies can improve your results.
Ready to take your baseball analysis to the next level?
GoRout Connect has advanced sports analytics tools for teams that want to win. It combines the newest technology with user-friendly interfaces that improve your coaching experience.
Get a quote today.
FAQs about Baseball Data Analysis
How is data analytics used in baseball?
Baseball teams use data to make smarter calls about players and game strategy. Analytics help you see beyond basic stats like batting average.
Teams collect data on exit velocity, launch angle, and spin rate with systems like Statcast. This helps predict future performance more accurately than old-school methods ever could.
Coaches use data to decide when to steal, position fielders, and pick pitchers. Analytics also help teams find overlooked players and make better trades.
How much does a baseball data analyst make?
According to ZipRecruiter, baseball data analysts in the United States earn an average of about $82,640 per year, or roughly $39.73 per hour.
Most salaries fall between $62,500 and $97,000, while top professionals can earn up to $120,500 annually.
Actual pay depends on factors like experience, expertise, location, and the organization’s size or budget.
How to get into baseball data analytics?
Start by learning statistics, programming (try Python or R), and database management. Take data science or sports analytics courses if you can find them.
Build a portfolio by digging into public baseball data from sites like Baseball Savant, FanGraphs, or Baseball Reference. Make visualizations and write up reports to show off your skills.
Network with people in baseball through conferences, online groups, and internships. A lot of analysts get their start as interns with teams or sports media companies.
How to analyze baseball stats?
Start with basic metrics like OPS (on-base plus slugging) and ERA. Get a feel for what each number actually means, and ask yourself why it matters.
Always use context when you compare players. Ballpark factors, era adjustments, and sample sizes can totally change the story.
One hot streak doesn’t really define a player’s true ability, no matter how tempting it is to think so.
Check out predictive metrics like FIP for pitchers or xwOBA for hitters. These stats try to strip out luck and show what might happen next.

