Baseball Pitching Charts: A Guide for Coaches & Players
Reading Time: 10 minutes
Reading Time: 10 minutes
Baseball pitching charts track various data points to help coaches and players gain a better understanding of a pitcher’s performance. Whether in a live game situation, bullpen work, or a flat ground session, pitching charts for baseball provide concrete feedback about key performance metrics.
Every team approaches charting pitches their own way, though a majority of charting tracks:
- Pitch count
- Velocity
- Location, and
- Other core data points.
With this information, coaches and players can identify strengths and weaknesses within their performances and tendencies. Coaches develop plans to build upon strengths and address weaknesses, and utilize data from pitching charts to inform their game plan and strategy.
Pitching charts put players and coaches in a better position to succeed on the mound. In this resource, we’ll provide a comprehensive overview of baseball pitching charts.
Continue reading to learn:
- What baseball pitching charts are
- Why pitching charts for baseball are important
- Different types of baseball pitching charts
- How to chart pitches in baseball
- Tips for charting pitches
- Coaching tools to maximize pitching charts
What Are Baseball Pitching Charts?
Baseball pitching charts are resources for coaches and players to document pitcher performance in games and bullpen sessions. A pitching chart can track various details such as pitch type, location, and result for each hitter faced by the pitcher, allowing for cumulative analysis over a game or by inning.
Pitching charts are categorized into traditional charts that track game flow and modern charts focusing on the characteristics of pitches:
- Traditional paper-based charts rely on coaches or players physically charting each pitch of a bullpen session or game appearance.
- Modern pitching charts can visualize pitch movement including spin direction and velocity tracking throughout a game, and are often electronic. Some incorporate video elements.
Higher levels of play, like major universities and professional leagues, may use advanced pitching charts that include metrics like FIP (Fielding Independent Pitching), xERA, and K-BB% to assess a pitcher’s true talent.
Why Are Pitching Charts Important In Baseball?
Pitching charts are valuable to both coaches and players because they provide a documented account of a pitcher’s performance. Charting allows players to visualize their performance and identify areas they need to work on. Coaches gain the same insights as players, along with additional data to aid their strategic game plan.
Here are some of the most important benefits of baseball pitching charts:
- Pitch selection & sequencing
- Injury prevention
- Isolating pitcher performance
- Evaluation and development for informed decisions
- Identifying tendencies
Pitch selection & sequencing
Between bullpen charts and in-game data, pitching charts provide insight for coaches making the calls on game day. Pitching charts help optimize pitch selection by revealing which pitches generate the most swings and misses or weak contact. They also help coaches identify tendencies in both opposing batters and their pitcher on the mound.
With the help of charts and data, coaches can dial up effective sequences to keep batters guessing and help their pitching staff control the game.
Injury prevention
One of the most important aspects of pitching and managing pitchers in baseball is arm health. Pitching charts can aid in injury prevention by tracking metrics like pitch counts and velocity dips to identify fatigue early.
If a pitcher has thrown too many pitches in a short period of time, or are struggling to hit their typical velocity, coaches can advise them to take things easy and work toward building back strength.
Isolating pitcher performance
Baseball is a team game and sometimes the defense lets down their pitcher. In those instances, traditional scorekeeping and statistics don’t tell the whole story.
Charts can isolate pitcher success by removing defensive variables, focusing on metrics like strikeouts and walks.
Evaluation and development for informed decisions
Data-driven insights are essential for evaluating and developing players, allowing coaches to make informed decisions based on performance metrics. The full spectrum of pitching charts enables baseball coaches to thoroughly evaluate a pitcher’s performance and abilities.
Numerous bullpen charts and all of the data compiled during in-game performances provides a wealth of information for coaches to review. From there, they can take their findings and create an action plan with suggestions to help pitchers develop into their full potential.
Identifying tendencies
Pitch charts can be used to identify tendencies in a pitcher’s performance. Coaches use pitching charts to identify if a pitcher has consistent misses or struggles with certain pitches. Pitching charts can also be used to analyze a pitcher’s performance against specific hitters, helping to identify tendencies and improve strategic decisions during games.
Players and coaches can use general data from pitching charts to gather this information, but there are also specific charts to track tendencies in numerous situations.
What Are The Different Types of Baseball Pitching Charts?
There is no one-size-fits-all when it comes to baseball pitching charts. Depending on your philosophy, goals, roster, and other factors, you’ll need to identify the best type of chart for your needs.
The American Baseball Coaches Association (ABCA) offers a robust library of baseball charts and documents, with a selection of pitching-specific scouting charts. To learn more and find the right option for you, visit the ABCA Charts & Documents library.
The three main types of baseball pitching charts are:
- In-game
- Bullpen, and
- Additional strategic charting methods

Game charts track pitch counts, pitch results, and player performance in live games, while bullpen charts track command and consistency during practice. Compact versions of pitching charts are available, which save paper but may be more challenging to input information into, while still allowing for the collection of significant data.
In the sections below, we’ll break down the different types of pitching charts for baseball in greater detail.
In-Game
Pitch Count & Velocity Chart
The Pitch Count & Velocity Chart is one of the most basic and essential types of pitching charts for baseball.
It provides a quantitative account of a pitcher’s performance pitch-by-pitch, documenting key statistics and data including:
- Pitch number/count
- Velocity (MPH)
- Pitch type
- Strike or ball
At the bottom of the chart is a game summary that tracks:
- Total pitches
- # of strikes
- # of balls
- Walks and strikes
- Number of pitches by pitch type
This chart is valuable to coaches and pitchers at every level, as it documents specific data at a granular level while providing a comprehensive overview of the performance.
Pitcher’s Location and First Pitch Strike Chart
The Pitcher’s Location and First Pitch Strike Chart is a pitching chart that visualizes a pitcher’s performance and highlights first-pitch effectiveness. Designed similar to a baseball scorebook sheet, this chart breaks down the opposing lineup by batter with multiple pre-designed at-bats for each.
Let’s take a look at each component of this chart:
- Location. A visual of the baseball strike zone, divided into nine “zones”, enables coaches and players to visualize a pitcher’s command by at-bat.
- First pitch strike. While the chart tracks location for every pitch, there’s a specific section to mark whether the first pitch was a strike or not.

These two bits of information work hand-in-hand, together providing a detailed account of a pitcher’s command within a given performance. Compiled throughout the season, it helps coaches and players identify trends and tendencies in command and control.
Location and first pitch strike data is valuable for players and coaches of all skill levels. It can be particularly beneficial in age brackets where players are first developing as pitchers. If your team struggles with walks and allowing runners on base, Location and First Pitch Strike Percentage is the perfect chart to identify the issue and enable coaches to work on a fix with players.
Other variations of the chart exist that combine location and first pitch strike tracking with a standard pitch count and velocity chart. These serve as a one-stop-shop for quantitative in-game charting.
Pitcher Tendency Chart
The Pitcher Tendency Chart is a baseball pitching chart that tracks performance in specific scenarios.
This chart breaks a pitcher’s performance into the following categories:
- First pitch
- Leverage counts (when the pitcher is ahead)
- Neutral counts (even counts)
- Battle counts (when the pitcher is behind)
- All (a summary of all pitches in a performance)
The chart is more suited for competitive leagues and programs (travel baseball, high school, and above) where coaches are more focused on results versus skill development.

Pitcher’s Quality Inning Chart
The Pitcher’s Quality Inning Chart is a pitching chart that evaluates performance by inning, while providing a detailed account of an entire game.
It tracks the following data in each inning:
- # of hitters put out in 4 pitches or less
- # of first pitch strikes
- Total strikes
- Total balls
- Total pitches in the inning
- 15 pitches or less (yes or no)
- 1-2-3 inning (yes or no)
- Made a defensive play (yes or no)
- Back up bases
- No runs (yes or no)
- Quality inning (yes or no)
The purpose of this chart is to identify how many innings out of a total performance were deemed quality. To pitch a quality inning, players have to win 4 out of the 6 bolded data points from the list above. The chart also features an inning-by-inning scoreboard and a summary of all pitchers who appeared within the game.
Bullpen
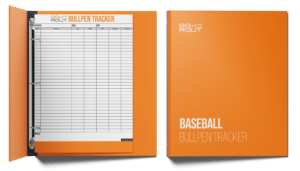
Bullpen Tracker
The Bullpen Tracker is a baseball pitching chart that provides comprehensive documentation of a bullpen session.
Similar to the Pitch Count & Velocity chart, the Bullpen Tracker covers the following data points:
- Pitch number
- Type of pitch
- Ball or strike
- Velocity (MPH)
- Location (description)
- Whether the desired call was executed or not
Download GoRout’s free Bullpen Tracker, a useful resource for coaches and players to access in a free printable PDF file.
Bullpen Location Charting
While the standard Bullpen Tracker offers descriptive accounts of location, some bullpen pitching charts feature a visual depiction of location.
Bullpen Location Pitching Charts provide a visual representation of the strike zone. Each pitch gets charted within the visual. To break down performance by pitch type, you can develop your preferred charting system. Common approaches include using a numbered system where each number corresponds to a specific pitch type, or using abbreviations (ex. CH for changeup, CB for curveball).
Visual location charting is useful for pitchers struggling with or working on command.
Additional Strategic Charting Methods
Outside of the previously mentioned charts, there are additional types of charting and tracking that help coaches assess performance and strategize their game plan.
Some examples include:
- Pitcher Assessment Report. A chart that coaches use to evaluate a pitcher’s performance subjectively. It provides a ranking system of below average, average, and above average to rank different components of a pitcher’s performance.
- Weekly Pitching Planner. This document is used to schedule your entire pitching staff’s schedule within any given week. Coaches can outline which pitcher they plan to put into games, who is scheduled to throw bullpen sessions, and more info about the weekly schedule.
- Perceived Pitch Speed Chart. Specifically useful for leagues where the pitching mound is closer than 60’ 6” (MLB/Collegiate/High School distance), this chart calculates the perceived speed of pitches from closer distances. Perceived pitch speed is what the pitch speed would feel like if it was thrown from 60’ 6”, based on reaction time.
How to Chart Pitches in Baseball
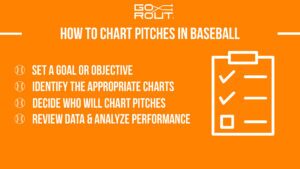
Every team has a different approach to charting pitches. Regardless, the process of developing your pitch charting strategy as a coach follows four key steps:
- Set a goal or objective. Determine what you want to get out of charting. Many coaches want comprehensive, quantitative documentation while others prefer visualization and location tracking. Some prefer multiple charts for a variety of different purposes.
- Identify the appropriate charts. Once you know what you hope to achieve in charting, find the right chart to accomplish that goal. If your team is struggling with walks and falling behind, the Location and First Pitch Strike Chart is a smart choice.
- Decide who will chart pitches. Some coaches prefer to chart their own pitchers, while others assign the task to an assistant coach or pitchers that aren’t scheduled to appear in the game.
- Review data and analyze performance. After each game or bullpen session, review charts and evaluate the performance using your preferred criteria and objectives.
Tips for Charting Pitches
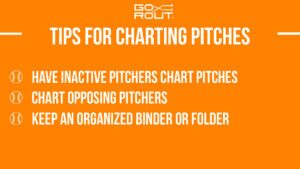
Now that we’ve covered the different types of charts and how to chart pitches, let’s take a look at some tips for charting pitches.
- Have inactive pitchers chart pitches. For the basic bullpen and in-game charts, assign the task of charting to other pitchers who won’t appear in the game. This helps them learn how to accurately chart pitches and analyze their teammates’ performance. More complex charts may be better suited for trusted assistant coaches or the manager.
- Chart opposing pitchers. There are scouting charts that assess tendencies of opposing pitchers. You can also use a standard in-game chart to track their performance for a better idea of how to prepare your players at bat.
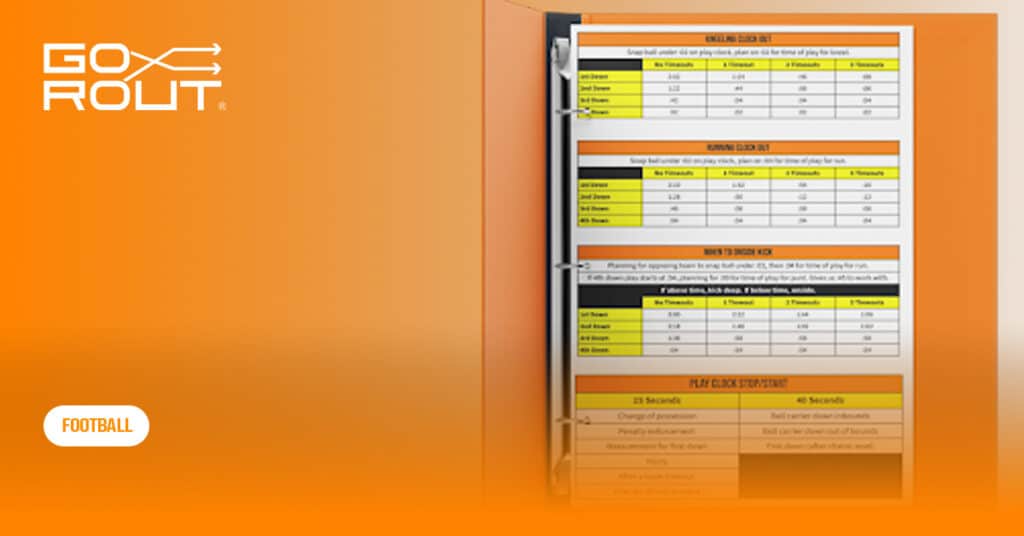
- Keep an organized binder or folder. As you accumulate charts through pre-season, bullpen sessions, and games, you’ll have a lot of papers to keep track of. You need a method to maintain order and locate specific charts quickly. Creating a binder or folder with a logical organization system in one place can help you get the most out of the data you’ve compiled.
These tips will help your players learn about charting and grow as pitchers, and help you develop your staff and game plans more effectively.
Coaching Tools to Maximize Pitching and Scouting Charts for Baseball
Pairing certain coaching tools with pitching charts enhances your game plan and player development. Many coaching tools and products are designed to streamline data collection and analysis, enabling coaches to make informed decisions based on player performance metrics. Some businesses hide their tools behind a paywall at varying prices, while other free options are available.
Two coaching tools at GoRout that can be helpful to your team’s performance include:
- GoRout Diamond Pitch Calling Device
- GoRout’s Baseball Coaches Toolbox
GoRout Diamond Pitch Calling Device
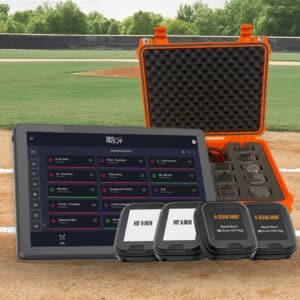
GoRout Diamond is a communication tool that allows coaches to interact with players on the field with a single button push, facilitating in-game strategy adjustments. A real-time, encrypted pitch calling device, GoRout Diamond enables coaches to effectively communicate pitch calls to their team without miscommunications or opponents stealing signs.
The coach-to-player communication system features:
- A tablet or mobile device for coaches to send calls from, and
- Wrist-worn devices for players to receive calls from.
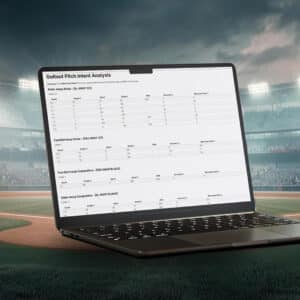
GoRout’s pitch calling watch and system comes with advanced analytics through GoRout Connect. In partnership with AWRE, GoRout Connect provides coaches with automated reports using pitch call data, including:
- Spray charts
- Heat maps
- Strike zone data, and
- Pitch intent vs. result breakdowns
Utilizing GoRout Connect’s advanced analytics, such as player tracking and performance data, can significantly enhance player development strategies.
Interested in learning more about GoRout Diamond? Get a quote today!
GoRout Baseball Coaches Toolbox
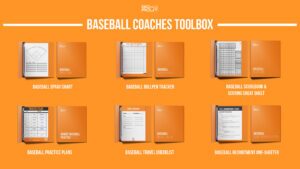
Effective coaching tools can include various charts and templates that help coaches track player performance, game strategies, and in-game decisions. GoRout’s Baseball Coaches Toolbox is a one-stop-shop for templates and resources to help get the most out of your team, free of cost.
View GoRout’s Baseball Coaches Toolbox for the following resources:
- Baseball scorekeeping cheat sheet
- Baseball scorebook sheet
- Baseball practice plan
- Baseball spray chart
- Baseball travel checklist
- Baseball lineup card
- Baseball recruitment one-sheeter
Each resource comes as a printable PDF document to download and share with your team, delivered directly to your inbox upon completing your information.
Share This Article
Related Articles


Big-League Analytics in your dugout for free
With GoRout Connect, GoRout Diamond customers receive access to AWRE Sports suite of analytics tools for free!