What Is The Best Software For Softball Spray Charts (USA)?
Reading Time: 6 minutes


Reading Time: 6 minutes
If you coach or play softball, you know how important it is to understand hitting patterns and defensive positioning. The right softball spray chart software removes the guesswork and helps you make smarter, data-driven calls.
The best software for softball spray charts in the USA gives you real-time insights, helping you track every ball, spot trends, and fine-tune both offense and defense.
Today’s spray chart tools use simple data entry and sharp analytics to break down performance. Tools like GoRout Connect blend visual charts, pitch tracking, and player stats to help you tweak your strategy.
In this guide, we will explain how, with the right software, you can break down plays, spot tendencies, and make better calls game after game. It’s all about turning raw data into something you can actually use in the field.
The Basics of Software for Softball Spray Charts

Data has changed softball coaching a ton in recent years. What used to be scribbled notes or pure gut feeling now relies on tools that track every hit, pitch, and play. These apps turn numbers into visuals that make your team’s habits obvious.
Spray charts show where each ball is hit on the field. You can see patterns, like whether a player tends to pull the ball or hit to the opposite field.
It helps you shift your defense or plan batting practice with less guesswork. By checking updated data after each game, you can spot small changes before they become big problems.
Modern software makes this process quick. Instead of drawing charts by hand, you load in the data, and the program builds interactive visuals in minutes.
Many apps even link to video clips, so you can watch the swing that led to each result.
One standout is GoRout Connect, which combines spray chart tools with pitching and defensive analytics. It shows you real-time hitting zones, manages lineups, and analyzes player performance, all in one place.
| Feature | Benefit |
| Automated chart updates | Less manual input, more time for coaching |
| Video integration | Visual context for each hit |
| Multi-team access | Easy sharing with staff and players |
Using tools like these helps you coach smarter and react faster, inning by inning.
Understanding Softball Spray Charts And Their Impact
When you track your team’s hitting patterns with softball spray charts, you see where each ball lands during a game or season. These charts act as visual maps, recording every hit’s direction and distance.
Once you build this record, it’s easier to spot trends in both batting and fielding. Spray charts reveal player tendencies.
That info goes beyond looking at a batting average. Coaches and scouts use it to analyze a hitter’s tendencies on offense and shape defensive positioning in the field.
If your scouting report says a batter hits grounders to the right side, you can shift your defense before the next play. This insight turns simple charts into smart game strategies that can save runs and boost competitiveness.
| Type of Chart | Focus | Common Use |
| Traditional Spray Chart | Historical hit locations | Builds detailed reports and helps with post-game review |
| Predictive Spray Chart | Machine learning and data simulation | Forecasts likely outcomes for future plays |
Clear data visualization keeps everyone on the same page. When your reports are easy to read, you spend less time sorting numbers and more time actually coaching.
Key Features To Look For In Softball Spray Chart Software

When you’re picking softball spray chart software, look for tools that let you track, analyze, and improve player performance without adding a bunch of busywork. The right app should help you save time and give you useful insights into every play and pitch.
Real-time data tracking lets you record each at-bat instantly and see where the ball lands. Some systems even add pitching analysis to check accuracy and spin rate, like softball pitching analysis software.
Good software also includes custom dashboards and reporting tools.
You can compare players, track results, and filter stats by pitch type, count, or outcome. That makes it easier to spot patterns across your lineup.
Integration matters. The best apps connect spray charts with video tools and performance metrics, so you can review game clips right next to your charts.
It makes it easy to show players what to work on. Cloud access keeps everything organized, so your staff and players always see the same info.
Using Softball Spray Chart Software For Player Development
Softball spray chart software shows you where hitters place the ball and where pitchers throw. Over time, these charts reveal patterns that highlight player habits and help you make better training decisions.
Tracking hitting and pitching trends over time
Spray charts collect data on contact points, launch angles, and pitch results. By tracking these trends across games, you can measure player growth and see where consistency improves.
It’s one of the easiest ways to monitor real progress without guessing.
Identifying strengths and areas for improvement
Charts show both hot zones and weak spots. A left-handed hitter might crush outside pitches to left field but struggle with inside pitches.
Pitchers may hit the low zone but miss high more often. Visuals help you focus on drills where players need it most.
| Metric | What It Shows | How It Helps |
| Contact Zone | Where hitters connect | Refine swing path |
| Pitch Location | Target accuracy | Improve control |
| Spray Direction | Ball distribution | Adjust defensive positions |
Personalizing training plans with data
When you combine these charts with softball game analysis tools, you can build personalized practice plans. Synced dashboards turn raw stats into clear feedback for both hitters and pitchers.
Encouraging player accountability and engagement
You can share results directly with players so they see how practice changes outcomes. This openness builds accountability and keeps everyone invested in their development.
Over time, it encourages steady improvement and confidence in their skills.
Advanced Analytics With Software For Softball Spray Charts
Advanced spray chart tools let you go beyond basic hit maps and dig into real game data. You can track where every ball lands, how often hitters pull or go opposite field, and how those patterns shift over time.
It helps you make smarter, evidence-based tweaks to lineups and defensive alignments. Why guess when you can see the proof right there?
Modern systems like softball analytics software connect spray charts with deeper data analysis. They show you pitch types, contact quality, and outcomes, so you can spot trends that raw stats might miss.
You can then fine-tune batting practice to match actual needs instead of just going with your gut.
With predictive modeling, you get a peek at possible performance for upcoming games. The software digs into past events, weather, or pitcher matchups and gives you a sense of how players might do.
These analytics speed up your planning and cut out a lot of guesswork.
Comparing players and teams across seasons gets simple. Side-by-side charts and dashboards show hitting tendencies and defensive results year over year.
You can measure growth, adjust training loads, and actually see how consistency develops.
| Metric | What It Tracks | How You Use It |
| Hit Location | Distribution by field zone | Adjust fielding positions |
| Exit Velocity | Power on contact | Guide hitting mechanics |
| Pitch Result | Called or swung outcomes | Evaluate pitch strategy |
When your charts turn analytics into actionable strategies, your decisions get sharper. You lean on evidence, not just hunches, to prep players and guide every pitch or swing.
Conclusion About The Best Software For Softball Spray Charts (USA)
When you compare softball spray chart tools, you see a range of features, from simple charting to systems packed with analytics and custom dashboards. Each one helps you track tendencies, spot hitting patterns, and plan smarter defensive matchups.
Some give you strong visualization and flexible reporting options. They help you study how players perform in different situations and make scouting reports faster to build.
However, if you want a solution that connects real-time stats, spray data, and player feedback in one place, GoRout Connect stands out.
It makes tracking easy during games and practices. You can view hitting zones, adjust training plans, and share insights instantly with your team.
FAQs About the Best Software for Softball Spray Charts (USA)
Does GameChanger have spray charts?
Yes, GameChanger includes both batting and pitching spray charts. You can check out where each ball was hit over the season to spot strengths and weaknesses.
That lets you tweak practice plans and game strategies based on real data, not just guesswork.
What is the software for pitch tracking?
Several tools track pitches in detail. You might use apps like GoRout Connect, PitchAware, Synergy Sports, or Charts Analytics to see pitch location, type, and count.
Many programs also create heat maps and visual reports so you can spot performance trends fast.
What are the benefits of using 643 Charts?
6-4-3 Charts pulls in data from Synergy, Trackman, and other sources into one platform. You get interactive visuals, custom reports, and solid team support.
It helps you break down player performance and scout opponents more efficiently.
| Feature | Benefit |
| Data integration | Combines video and stats from multiple systems |
| Custom visualization | Helps simplify complex data |
| User support | Former coaches assist with training and setup |
Who uses 643 Charts?
Lots of U.S. college programs across the NCAA, NAIA, and NJCAA count on 6-4-3 Charts. Some professional organizations use it too, especially for scouting or player development.
You’ll spot it most often in programs that really care about having accurate data to fuel their competitive decisions.
Share This Article
Related Articles



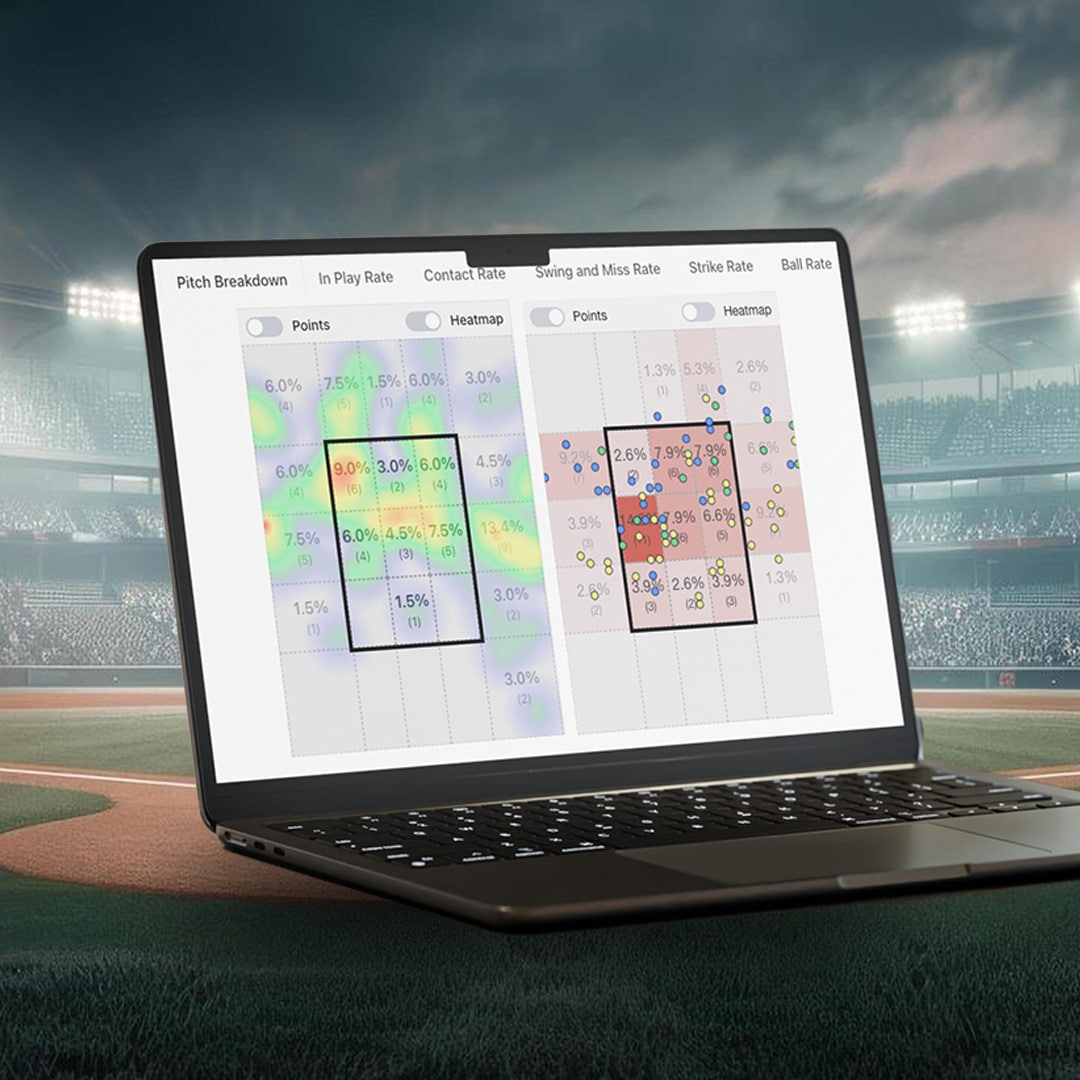
Big-League Analytics in your dugout for free
With GoRout Connect, GoRout Diamond customers receive access to AWRE Sports suite of analytics tools for free!