Modern Baseball Analytics
Reading Time: 5 minutes


Reading Time: 5 minutes
You’ve probably noticed how data analytics shapes almost every play on the field.
Professional baseball has become as much about insights as instincts, and analytics helps you make smarter calls with real numbers. As technology becomes more accessible, amateur and youth coaches can use and leverage professional-grade analytics too.
In this post, you’ll explore how modern baseball analytics has evolved from basic stats into a powerful coaching system.
You’ll see how new metrics and tracking technology reveal patterns that used to stay hidden, so you can coach smarter and make every decision count.
The Basics Of Modern Baseball Analytics

In baseball history, analytics were mainly about using basic numbers to understand performance. Today, real-time data guides decisions that used to depend on instinct alone.
Modern tools track every pitch, swing, and defensive play, helping baseball teams make smarter and more informed choices.
You might focus on advanced stats like wOBA (Weighted On-Base Average) or FIP (Fielding Independent Pitching) to measure player performance. These numbers show how players performed in greater detail than just hits or runs. Data on spin rate, exit velocity, and launch angle give you a clearer view of what drives success.
Modern baseball analytics have also reshaped coaching and scouting. With systems that collect and display live data, coaches tailor practice to individual player needs. Scouts use trends and projections to spot hidden potential, on top of what they see on the field.
College programs use college baseball analytics to evaluate players and plan long-term development.
Advanced Metrics That Define Modern Baseball

Baseball has moved well beyond traditional statistics like batting average and ERA. New advanced metrics help teams understand players better, make smarter decisions, and see a player’s true value on the field.
Offensive metrics
Offensively, exit velocity and launch angle are must-haves.
Exit velocity (EV) measures the speed of the ball off the bat, the amount of power, and the quality of contact.
Launch angle (LA) tracks the trajectory of the ball and predicts line drives or home runs.
Add on-base data, such as on-base percentage (OBP), which shows a player’s ability to get on base safely, and you have a complete picture of offensive efficiency and potential.
Pitching analytics
Pitching has gone analytic, too, with spin rate (RPM) being a key factor. Higher spin rates create sharper breaking balls, which are harder to hit.
Pitch movement data shows the path and break of each pitch, and release consistency shows a pitcher’s control and deception.
Together, these advanced baseball statistics refine pitching strategy and player development.
Defensive metrics
Defensively, teams look at fielding range, such as Ultimate Zone Rating (UZR) or Outs Above Average (OAA), to see how much ground a player can cover.
Positioning data shows where to put a player based on batter tendencies, and reaction time shows how quickly a defender reacts to plays.
These metrics improve defensive efficiency and overall team performance.
Advanced metrics and AI in baseball have made baseball a data-driven sport. By using offensive, pitching, and defensive metrics, teams have a competitive edge and new levels of performance and strategy.
The Role Of Technology In Modern Baseball Analytics
Technology has turned baseball data analysis from pencil marks on a scorecard into an instant stream of real-time data. You don’t have to wait until after the game to see trends anymore.
Every pitch, swing, and catch becomes usable information the moment it happens. High-speed cameras and radar systems track ball velocity, spin rate, and release point with crazy precision.
These tools record millions of data points each season. When you connect them to a baseball analysis app, you get deeper insights that used to take hours to find.
Wearable sensors make performance tracking more complete. They gather motion and workload data, helping you see how fatigue or mechanics affect game flow.
This kind of analysis makes it easier to manage pitch counts, recovery, and injury prevention.
Video technology also plays a big role. Integrated video feeds let you match plays with analytics, so you can spot trends or inefficiencies in batting stance or pitcher timing. By blending visuals with game data, you see the story behind the numbers.
GoRout Connect takes this mix of data collection and analysis even further. It links live readings, scouting input, and tactical notes directly into your coaching plan with easy baseball analytics tools.
The platform turns digital stats, from expected ERA to defensive routes, into simple, actionable insights you can use right in the dugout.
Player Evaluation Through Modern Baseball Analytics
Modern baseball analytics help you see players more clearly than ever. Instead of relying only on traditional stats, you can combine data on speed, reaction time, pitching mechanics, and defensive skills to get a full picture of player value.
This approach makes evaluating players more accurate and less based on guesswork. With tools like GoRout Connect, you can look closely at every part of a player’s performance.
By tracking outcomes and comparing trends, you spot undervalued players who might not stand out by old standards but contribute in hidden ways. Analytics highlight consistency, adaptability, and improvement over time.
You can also use this info to make customized training plans for specific areas for growth. When the system captures live data during practice and games, it becomes easier to adjust workloads and focus drills on what each player needs most.
This process supports steady player development and helps reduce injury risk. By combining all this with baseball performance analysis, you gain real insight into how players grow and adapt.
The Future Of Modern Baseball Analytics
The future of modern baseball analytics is faster data, smarter tools, and deeper insights to help teams make better decisions on and off the field.
What started with basic stats has grown into a system that tracks almost everything a player does. As technology improves, the analytics framework will get more precise, accessible, and important at every level of the game.
One big change is real-time data. Instead of reviewing film or waiting for post-game reports, coaches and players can now see pitch movement, swing paths, fielding routes, and hit locations in real time.
Teams can adjust in moments. Future systems will get even faster and give coaches a live, automatic breakdown of what’s happening and why.
Another trend is personalization. Instead of using the same stats for everyone, players will get reports based on how they move, what they do, and how they perform.
Pitchers will get feedback on every pitch, how they released the ball and how consistent the spin was. Hitters will see visuals of when they dropped their hands or pulled away from the ball.
It will make training more targeted and more effective.
Analytics will play a bigger role in scouting and roster construction. With more detailed performance data worldwide, teams will be able to find talent earlier and evaluate players more accurately.
Undervalued players, once overlooked, will be easier to find through improved metrics that highlight hidden strengths.
And analytics will reach fans in new ways. Broadcasts and stadium displays will continue to add interactive visuals and advanced stats to help fans understand the strategy behind each play.
Overall, the future of baseball analytics is technology meets strategy, giving teams clearer info, faster responses, and a bigger edge.
Conclusion About Modern Baseball Analytics
Baseball analytics has come a long way. We’ve gone from scribbling stats in notebooks to using real-time data tools that shape every pitch, swing, and defensive move.
Numbers like WAR, FIP, and wOBA now reveal player value way beyond the old box score. Coaches get to skip the guesswork and make decisions that actually move the needle.
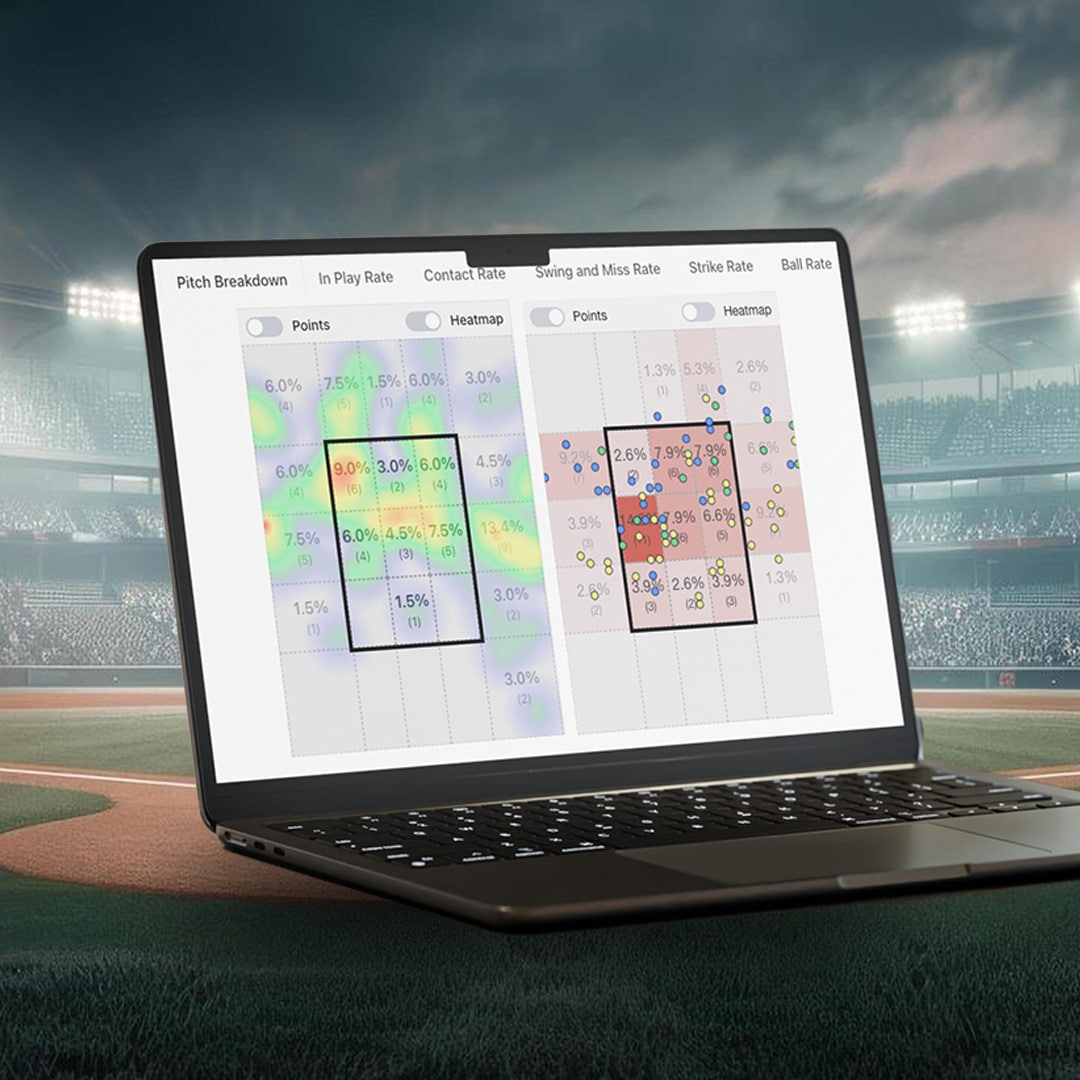
With GoRout Connect, you get insights delivered fast and clean, right in the dugout. The platform pairs instant charting with handy tools like Strike Zone Maps and Spray Charts.
You can spot trends without slowing down your coaching flow. Quick calls and on-the-fly adjustments feel much easier with data that’s actually readable.
Here’s a quick look at what GoRout Connect brings:
| Feature | What It Does | Benefit |
| Real-time pitch data | Tracks every pitch and result automatically | Saves time and boosts accuracy |
| Instant sync | Links your tablets and software automatically | Keeps everyone in sync |
| Visual reports | Displays charts and patterns clearly | Helps you coach with precision |
Share This Article
Related Articles



Big-League Analytics in your dugout for free
With GoRout Connect, GoRout Diamond customers receive access to AWRE Sports suite of analytics tools for free!