Why GoRout Connect Is the Best Baseball Spray Chart App in 2026
Reading Time: 10 minutes


Reading Time: 10 minutes
You know every swing, pitch and defensive shift matters in a live game. That’s why having a clear picture of hitting patterns can change how you plan and coach.
GoRout Connect gives you the top baseball spray chart app because it takes raw hitting data and turns it into real-time, easy-to-see patterns so you can make better decisions on the field. It goes far beyond baseball scoring software and combines analytics, communication, and coaching strategy all in one place.
In this post, you’ll dive into how spray charts power better gameplay, why GoRout Connect is a game-changer, and how you can use it for player development and coaching decisions.
The Basics of Baseball Analytics And Spray Chart Apps

Baseball analytics have come a long way from basic stats in box scores.
Coaches now use digital tools to track pitches, hits, and defensive plays with accuracy that manual baseball scorekeeping can’t match. There are apps for both baseball and softball, with features for each sport.
Modern systems turn every movement on the field into useful stats you can act on during games or practice.
Analytics apps give you a deeper look at how players perform over time. You can study exit velocity, pitch location and defensive range to see where a new pitcher or player excels or needs work. Many apps now include pitch-tracking features so you can chart pitches, track pitch type, and record pitch speed for game analysis.
Modern baseball analytics helps you base decisions on objective data.
A spray chart app shows where every batted ball lands. These charts look simple but reveal big insights, like whether a hitter tends to pull or go opposite-field. For fielders, that means smarter positioning. For hitters, it’s a visual way to spot patterns and adjust their approach faster.
GoRout Connect takes those insights even further.
The intuitive app combines communication, scoring screen, and performance data into a single platform. You can track live hits, view instant heat maps, and share updates with your team right on the field. You can download the app on any mobile device and enter and review data seamlessly.
This tremendous tool lets you spend less time sorting data and more time actually coaching.
The Importance Of Spray Charts In Baseball
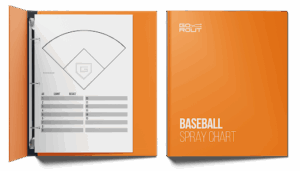
Spray charts help you see patterns in where a batter hits the ball. By plotting each hit on a field diagram, managers get a visual record of how a player performs over time.
Spray charts also provide game information and support reporting so coaches and teams can access stats, scores, and play-by-play details for deeper analysis.
You can use that data to make better coaching and game decisions. The way coaches use data includes analyzing each at-bat and reviewing each pitch to inform strategy based on prior encounters with pitchers.
Check out the GoRout Baseball Spray Chart to make smarter plays.
How spray charts help visualize hitting tendencies
When you record every batted ball, you start to notice habits. Maybe a left-handed batter pulls most pitches to right field or a right-hander hits grounders up the middle.
These trends show where a player finds success and what adjustments might be needed to make a difference.
With digital tools, you can track these patterns more easily and connect them to broader baseball analytics to understand why certain results happen.
Using spray chart data for defensive positioning
Spray charts also guide how you set up your defense. If a hitter sends the ball to the right side, you can shift your infield and outfield accordingly.
Even a slight adjustment can turn would-be hits into outs.
Teams now use real-time updates to change positioning mid-game so their defense is more flexible and data-driven.
Spray charts in scouting and opponent analysis
Spray charts give you an edge before a game. Reviewing past data helps you prepare for opponents by spotting trends and weaknesses.
You can analyze at-bats and pitches for your team and opposing teams, giving you a full view of performance and tendencies. You can plan your pitching strategy and defensive alignment before you even step on the field.
Sharing these reports with coaches and players keeps everyone on the same page and focused on key threats.
Why accurate data visualization leads to better decisions
Accurate charts make the numbers easy to understand. Clean visuals, like color-coded hit types and clear field zones, help you react fast during a game.
Better visuals mean less guessing and more informed calls.
Key Features Of A Baseball Spray Chart App

You can watch every swing, hit, and where the ball goes as it happens. Real-time tracking helps you notice patterns quickly and change your defense right away.
With live stats going straight to your dashboard, you can stay updated and make good decisions.
The app makes it easy to enter and update the score while the game is happening, so the game records are always accurate and current.
Interactive and customizable chart displays
A good spray chart app lets you customize views for each player or game. You can switch between hit type, location, and result with a few taps.
The screen layout allows the user to quickly access features such as bringing in a pinch hitter or tracking runners, making in-game management seamless.
Interactive charts make it easy to explore performance trends and connect them with baseball analytics tools that go beyond basic stats.
Integration with video and analytics tools
Linking video clips with spray data adds context to every hit. You can compare swing angles, pitch types, and fielding results side by side.
This combination supports deeper baseball performance analysis and helps players understand what leads to strong contact or missed opportunities.
Cloud-based access and team collaboration
Cloud syncing keeps your data available wherever you are. You and your staff can review charts on a phone, tablet, computer, or laptop during or after games.
Users can track batter progress and update batter status in real time, ensuring all actions involving batters are accurately recorded. Everyone stays connected, which saves time during meetings and helps align strategy.
Secure data management and sharing capabilities
Reliable security keeps player stats and team strategies private. You can share reports or clips safely within your coaching staff.
Simple permission controls make sure only trusted users can view or edit sensitive information.
How GoRout Connect Changes Baseball Spray Chart Analysis
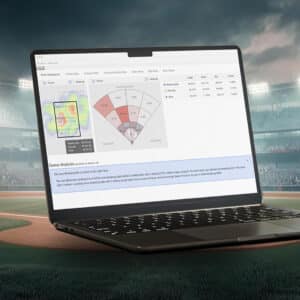
GoRout Connect is the newest operating system that changes how you handle spray chart data by combining communication, scoring, and analytics in one easy system.
It automatically links with AWRE Sports charting tools, so you get instant updates without doing extra work. These charting tools were developed over years of experience in baseball and softball, ensuring reliable, insightful data for coaches.
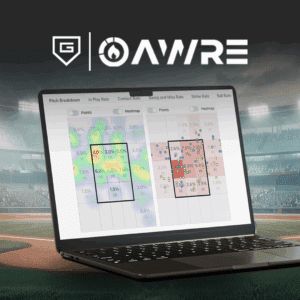
With this setup, every pitch, call, and ball in play become part of an organized visual report. You can filter spray charts by hitter, pitch type, or count to see exactly where contact happens.You can also track pitch speed to analyze pitcher performance and improve game management.
It helps you spot hitting patterns and field tendencies faster than manual charting ever could.
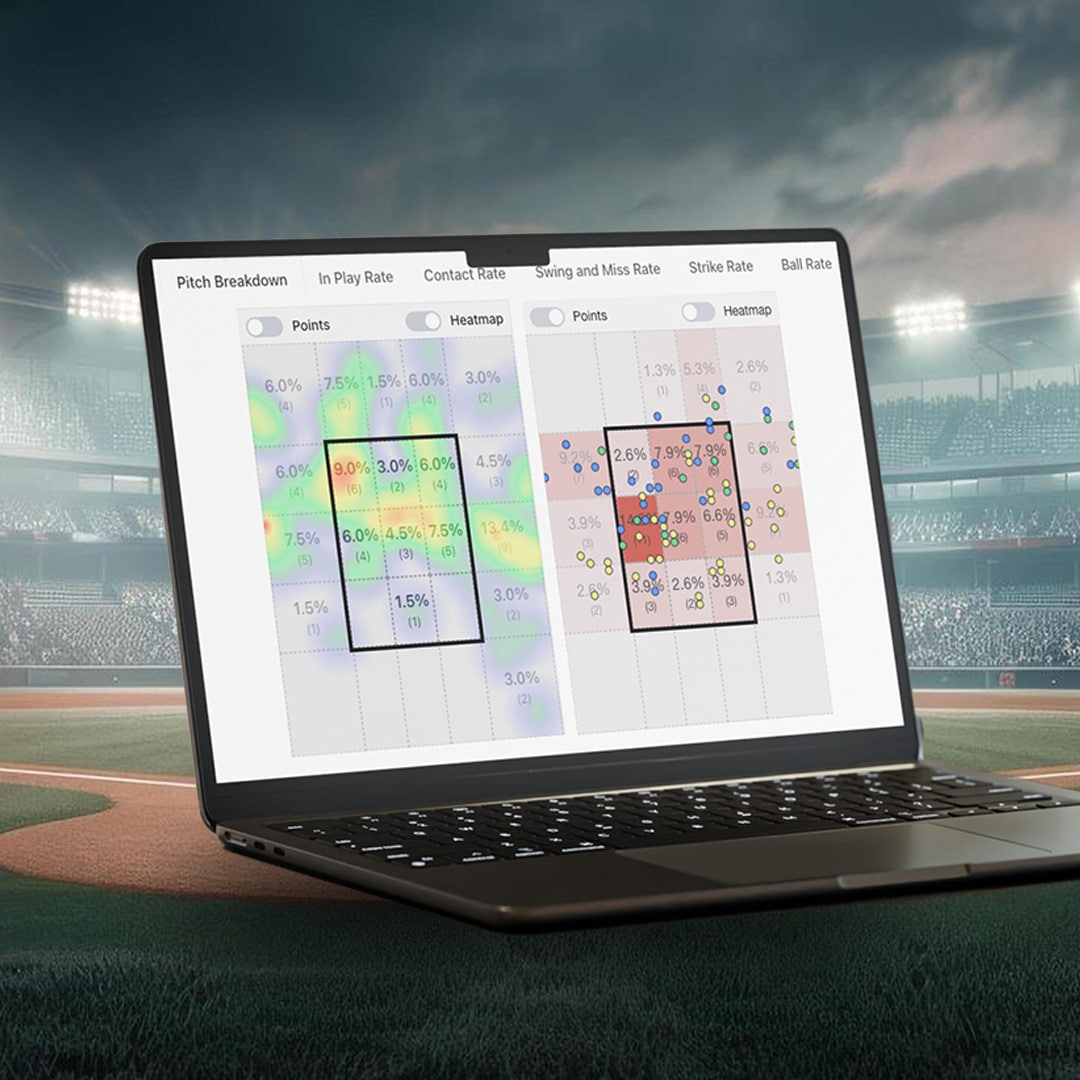
Pitch Intent vs Result comparisons show you whether your planned pitch locations match what actually happened. That feedback is created instantly to help pitchers improve by providing actionable insights and immediate challenges. This baseball analysis app also points out where adjustments in pitch selection or location might help.
| Key Feature | What It Shows | Coaching Benefit |
| Spray Charts | Ball contact locations | Identify offensive trends |
| Heat Maps | Strike zone activity | Adjust defensive shifts |
| Pitch Intent Data | Planned vs. actual results | Improve execution accuracy |
You don’t need extra devices or complicated uploads. Once synced, your GoRout Diamond tablet automatically pushes information into AWRE’s system. That means less time entering data and more time reviewing performance.
By using GoRout Connect, you turn game-day actions into fast, visual feedback that supports smarter coaching. It delivers professional-level data to your dugout seamlessly.
Enhancing Coaching Strategy With GoRout Connect
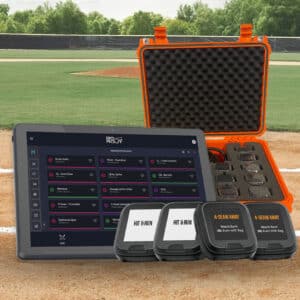
You can use GoRout Connect to bring your coaching staff and data together into a single, simple, real-time system.
The app’s spray chart tools show where hitters put the ball in play so you can plan defensive shifts without guessing.
The head coach can use GoRout Connect to lead team strategy so every decision is informed and aligned. That saves time and gives every player a clear direction before each pitch.
With data from every game, you can see patterns across competition. Those trends help you fine-tune scouting reports so players know what to expect before they step on the field.
When combined with college baseball analytics, the info is even more useful for in-game decisions.
During games, the system gives you real-time updates so you can make small but meaningful adjustments as situations change. For example, you might slide your infield based on recent ball placement or tweak pitch calls after reviewing zone heat maps.
Everything happens fast without breaking your rhythm in the dugout.
You also keep your whole staff connected. GoRout’s coach-to-player communication means no more mixed signals or confusion. Everyone sees the same play, shift or sign right away, reducing mistakes and improving team cohesion.
GoRout Connect keeps coaches, players, and key stakeholders connected and involved throughout the season.
Player Development Through Baseball Spray Chart Apps

Spray charts show you what each hitter does best. Maybe your leadoff hitter sprays the ball to all fields, and another consistently pulls pitches. By comparing spray patterns, you can adjust drills and lineups to match each player’s hitting zone.
| Data Type | What It Shows | Why It Matters |
| Hit Direction | Pull vs. opposite field | Reveals hitting tendencies |
| Launch Zone | Ground, line, or fly ball | Helps refine swing path |
| Hit Frequency | Number of contacts per area | Highlights the most productive regions |
Personalizing training plans using spray chart trends
When you see patterns, you can practice smarter. If your left fielder is grounding out on inside pitches, target that area in batting practice. These small data-driven tweaks turn general practice into focused improvement.
Tracking progress over time with visual analytics
Spray chart apps update automatically as you log more games. That makes it easy to track progress week to week or season to season. A quick glance at color-coded heat maps shows if changes made in practice actually improved contact distribution.
Encouraging player accountability and engagement
Players love seeing their results in simple visuals. A look at their spray chart shows what’s working and what’s not. When they can measure their own growth, they stay motivated and take ownership of their development.
How to Implement GoRout Connect in Your Baseball Program
Start by setting goals for how you’ll use GoRout Connect. Think about what you want to track, such as spray patterns, pitch trends, or defensive adjustments.
When you define targets early, it’s easier to see what success looks like and measure how much progress your team makes.
Spend time training your coaches and players. A short session on how to view stats, read charts and send updates goes a long way. The app’s user-friendly design makes onboarding new users quick and easy.
Once everyone understands the tools, they’ll use them more efficiently during games and practices. You can also explore related resources on baseball coaching software to support smoother team communication.
Integration is easy if you plan ahead. Sync GoRout Connect with your lineups, scouting reports or analytics platforms so your data flows naturally between systems. It keeps your information consistent and reduces duplicate work across devices. The app allows users to seamlessly switch between devices, so you can continue tasks without interruption.
Track your team’s results and adjust when needed. Use GoRout Connect’s real-time reports to compare expected outcomes with actual performance. A small tweak, such as refining defensive positioning or adjusting batting practice, can lead to big improvement over time.
Below is a quick look at what to monitor as you go:
| Area of Focus | What to Measure | How to Adjust |
| Batting Trends | Hit location, contact rate | Revise swing approach |
| Defensive Shifts | Field coverage efficiency | Update positioning strategy |
| Pitching Consistency | Strike zone accuracy | Modify bullpen sessions |
Advanced Analytics with Baseball Spray Chart Apps
Instead of digging through mountains of data, you get clear visuals that show hitting direction, contact quality, and defensive positioning. You can study these patterns and adjust your lineup or field setup right away.
With features like heat maps, pitch intent tracking, and swing zone data, spray chart tools show you things that box scores can’t. Many platforms also track pitch speed, so you can dive deeper into a pitcher’s velocity and performance trends.
Patterns start to emerge, such as who hits to the opposite field, who struggles with inside pitches, and how defensive teams respond. It gives you grounded coaching decisions.
Systems that use AI in baseball help predict outcomes, such as pitch success rates and probable spray areas, based on recent trends. The more data you feed in, the smarter the system gets over time.
| Feature | What It Shows | Coaching Use |
| Spray Chart Visualization | Ball distribution by hitter | Adjust field positioning |
| Heat Maps | Contact strength zones | Identify hitting sweet spots |
| Pitch Intent vs Result | Planned vs executed pitch location | Improve pitching accuracy |
When you combine these visuals with live data streams, you start to see cause and effect more clearly. You can adjust practice drills, shift defensive sets and match hitters to pitchers who suit their style.
The result is simple. You use data to make everyday coaching smarter and more effective.
Conclusion About Baseball Spray Chart App
When you track every hit and field pattern with a spray chart app, you see the game more clearly. You can see player tendencies, understand opponent shifts, and make smarter calls during live play.
FAQs About Baseball Spray Chart App
Does GameChanger have spray charts?
Yes, GameChanger displays basic spray charts showing where each batter hits the ball. You can see the hit direction and contact types during games or after. The charts are simple and good for quick reviews, but don’t offer advanced heat maps like GoRout Connect.
What is a free app like HitTrax?
If you want a free option like HitTrax, you can try a basic spray chart or batting practice tracker apps. They record hit location, contact type and totals during BP. These apps don’t use sensors or simulate ball flight, but still help you understand hitting patterns and track progress.
How much is the HitTrax mobile app?
The HitTrax mobile app is free to download, but many features require access to a connected HitTrax system. The system itself costs money because it includes cameras and sensors to measure swing and ball data. You can still see some data and session history if you’ve used HitTrax at a facility.
What is the best baseball swing analysis app?
That depends on what you need. If you just want swing feedback apps like Blast Baseball or Diamond Kinetics, they give good metrics. For a complete setup that links spray data, real-time stats and communication tools, GoRout Connect stands out. It combines everything in one place so you can track and analyze performance without extra gear.
Share This Article
Related Articles



Big-League Analytics in your dugout for free
With GoRout Connect, GoRout Diamond customers receive access to AWRE Sports suite of analytics tools for free!